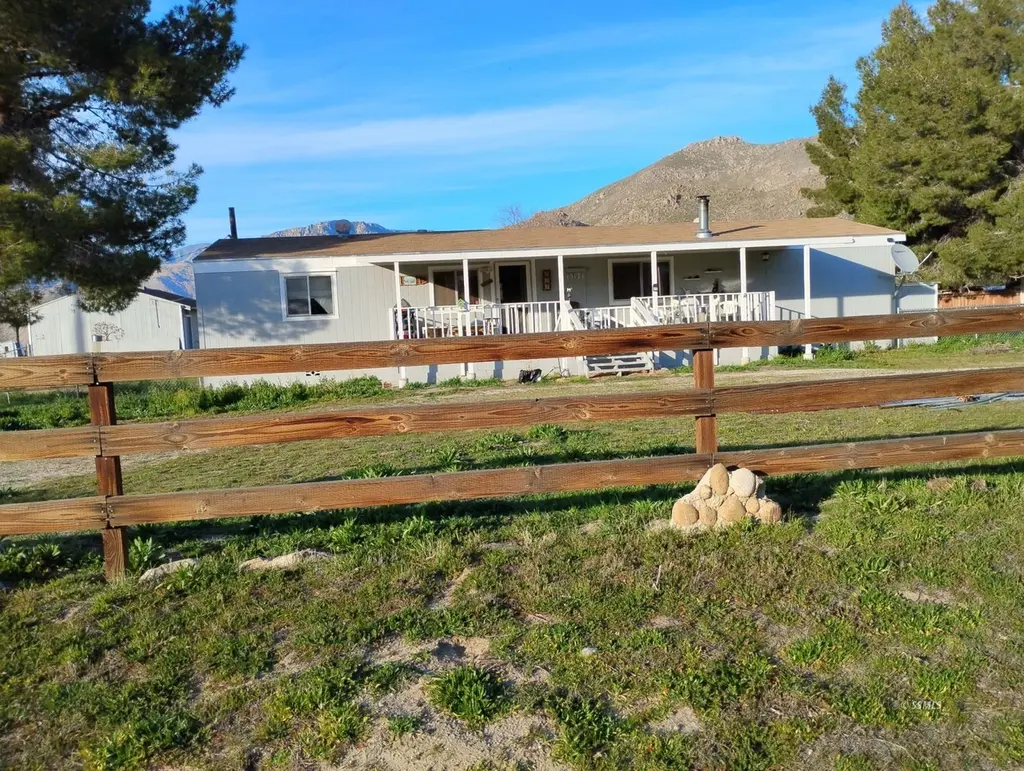
15171 Sage Ln
Weldon, CA 93283
$165,000D+
3 bd · 2.0 ba ·
1,440 sqft ·
Built 1982
· Manufactured
· Active
· 15 DOM
Cashflow @ list (25.0% down · 7.5%)
Estimated rent
$1,340/mo
Mortgage (P&I)
−$865
Tax + insurance
−$299
HOA
−$0
Vac / Maint / Mgmt
−$281
Net cashflow
$-106/mo
Annual
$-1,271/yr
Cap rate
6.43%
Cash-on-cash
0.50%
DSCR
1.02
1% rule
0.81%
Cash to close
$46,200
Investor read
- This is a 3-bed/2.0-bath manufactured listed at $165k.
- At list price, monthly cash flow is $-106 ($-1k/yr) — negative.
- To cash-flow at today's rent, offer at most $146k (11.3% below list).
- To meet the 1% rule (rent ≥ 1% of price), the offer needs to be $134k (18.8% below list).
- It's been on market 15 days — a 2% lower offer ($163k) is reasonable based on typical stale-listing flexibility.
- Recommended offer: $134k (18.8% below list) — sets the bar for 1% rule.
- In year one you build about $15k of equity ($1k loan paydown + $14k appreciation (8.7% local appreciation)).
- Location reads 48/100 on livability (#1,218 in CA) — a working-class tenant base; expect higher turnover. Strengths: cost of living A-, housing B+; Watch: amenities F, commute F, employment F.
- South Fork Union (rural): math 25% / reading 40% proficiency, ranked #1,016 of 1,400 in CA (top 73%) — families likely to look elsewhere, expect single-tenant / working-renter base with shorter leases; 67% free/reduced lunch — lower-income household profile, screen leases tightly.
- Zoned schools: South Fork Elementary (344 students, 71% FRL); Kern Valley High (reading 75%, 466 students, 72% FRL) — zoned schools at 71% FRL track the district average.
- Watch-outs: flood insurance adds $125/mo.
- Market conditions: 43 active listings in the ZIP; 3,244 units permitted in Kern County in 2024 (73 in 5+ unit buildings).
- Kern County population projected at +17% by 2050 — long-run rental-demand tailwind backs the buy-and-hold thesis.
- Current owner paid $84k; list at $165k implies a 96% gain — meaningful room to come down on a strong offer.
- By year 3, paydown + projected appreciation supports a ~$39k cash-out refi (75% LTV) — recoverable capital for the next deal without selling this one.
- Climate carrying-cost: in FEMA flood zone A (mandatory federal flood insurance); major wildfire risk; extreme-heat days projected 7→19/yr by 2055 (HVAC capex compounding) — expect insurance premiums to compound above CPI over the hold.
- Cap rate 6.4% vs local median 5.0% in Weldon — meaningfully above typical; check what's discounted (condition, days-on-market, listing class) to confirm the premium yield is real.
Questions for listing agent
- What do current leases actually rent for vs. the listed asking? Can we see a recent rent roll and the last 12 months of T-12 income?
- What's the actual annual flood-insurance premium (NFIP or private), and is the property in a SFHA with mandatory coverage?
- Is there a deadline driving the sale (1031 exchange, divorce, estate, relocation)? That informs how much negotiation room exists.
- Schools are F-rated, which usually means shorter tenancies and higher turnover. Who's the typical renter profile here, and what's been the actual vacancy rate?
- The area grade is low — what's the realistic commute time and amenity access for the typical tenant pool here? Any planned neighborhood developments (good or bad) we should know about?
- What's the average days-on-market for RENTAL listings here right now (not sales)? A rising rental-DOM trend means longer vacancies and softer asking-rent achievability than the comps imply.
- What's the recent tenant-quality profile in this submarket — average credit score on applications, eviction rate, late-payment / NSF rate, and stable-employment percentage? A property-management company in the area should have these aggregated.
- How much new for-sale + rental construction is in the pipeline within 1–3 miles? Heavy new supply typically softens prices + rents 12–24 months out; constrained supply supports both.
CashFlowRE · CFR-15RDPJ7QEFP7DM
· Data 4 h ago
cashflowre.app · 2026-05-29