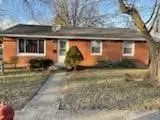
284 Forest Ave
West Milton, OH 45383
$157,900D
3 bd · 1.0 ba ·
1,040 sqft ·
Built 1958
· SingleFamily
· Active
· 107 DOM
Cashflow @ list (25.0% down · 7.5%)
Estimated rent
$1,200/mo
Mortgage (P&I)
−$828
Tax + insurance
−$170
HOA
−$0
Vac / Maint / Mgmt
−$252
Net cashflow
$-50/mo
Annual
$-600/yr
Cap rate
5.91%
Cash-on-cash
-1.36%
DSCR
0.94
1% rule
0.76%
Cash to close
$44,212
Investor read
- This is a 3-bed/1.0-bath single-family listed at $158k.
- At list price, monthly cash flow is $-50 ($-600/yr) — negative.
- To cash-flow at today's rent, offer at most $149k (5.6% below list).
- To meet the 1% rule (rent ≥ 1% of price), the offer needs to be $120k (24.0% below list).
- It's been on market 107 days — a 9% lower offer ($144k) is reasonable based on typical stale-listing flexibility.
- Recommended offer: $120k (24.0% below list) — sets the bar for 1% rule.
- Local home prices are declining (-3.0%/yr); year-one equity from $1k of loan paydown is wiped out by about $5k of value loss. Plan a longer hold.
- Location reads 64/100 on livability (#777 in OH) — a middle-class / working-renter tenant base. Strengths: cost of living A+, housing A-, crime B+; Watch: employment D+, amenities F, commute F.
- Milton-Union Exempted Village (rural): math 54% / reading 61% proficiency, ranked #324 of 656 in OH (top 49%) — acceptable for families but not a draw, mixed tenant base, ~2y average lease; 62% free/reduced lunch — lower-income household profile, screen leases tightly.
- Zoned schools: Milton-Union Elementary School (math 61% / reading 61%, grade B, #652 of 1,584 statewide, top 41%, 609 students, 0% FRL); Milton-Union Middle School (math 56% / reading 58%, grade B, #305 of 654 statewide, top 48%, 349 students, 0% FRL); Milton-Union High School (math 27% / reading 72%, grade D, #390 of 781 statewide, top 54%, 383 students, 99% FRL) — zoned schools average 33% FRL vs 62% district-wide (29 pts lower); this property's tenant base skews higher-income than the district average.
- Watch-outs: built in 1958 — expect roof / HVAC / electrical / plumbing capex.
- Market conditions: 22 active listings in the ZIP; 1 comparable units currently listed for rent nearby; 326 units permitted in Miami County in 2024 (0 in 5+ unit buildings).
- 2 sale attempts; this cycle's ask has dropped $22k (12%) from the opening price — seller is motivated, your offer sets the floor, not the list.
- Current owner paid $83k; list at $158k implies a 90% gain — meaningful room to come down on a strong offer.
- Cap rate 5.9% vs local median 4.2% in West Milton — top-decile yield for the area; either an underpriced asset or a hidden risk that comps aren't pricing in. Stress-test before assuming the spread holds.
Questions for listing agent
- What do current leases actually rent for vs. the listed asking? Can we see a recent rent roll and the last 12 months of T-12 income?
- It's been on market 107 days. Have you received any prior offers? Is the seller open to a 24% concession, seller financing, or rate buy-down credit?
- Built in 1958 — when were the roof, HVAC, electrical panel, plumbing, and water heater last replaced?
- Why hasn't it sold? Are there any deal-killer items the seller is aware of (foundation, flood, title, zoning, code violations)?
- Is there a deadline driving the sale (1031 exchange, divorce, estate, relocation)? That informs how much negotiation room exists.
- Schools are B-rated — typically a magnet for longer-tenancy family renters. What's the average tenant stay here, and is there a school-zone premium baked into asking?
- The area grade is low — what's the realistic commute time and amenity access for the typical tenant pool here? Any planned neighborhood developments (good or bad) we should know about?
- What's the average days-on-market for RENTAL listings here right now (not sales)? A rising rental-DOM trend means longer vacancies and softer asking-rent achievability than the comps imply.
CashFlowRE · CFR-15ZYNX4P36YH6F
· Data 4 days ago
cashflowre.app · 2026-05-29