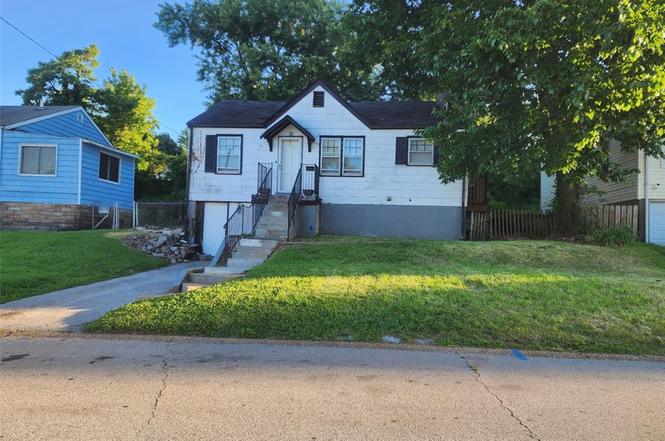
7164 Manette Dr
Flordell Hills, MO 63136
$65,000B-
2 bd · 1.0 ba ·
792 sqft ·
Built 1939
· SingleFamily
· Active
· 2 DOM
Cashflow @ list (25.0% down · 7.5%)
Estimated rent
$1,092/mo
Mortgage (P&I)
−$341
Tax + insurance
−$76
HOA
−$0
Vac / Maint / Mgmt
−$229
Net cashflow
$446/mo
Annual
$5,357/yr
Cap rate
14.53%
Cash-on-cash
29.43%
DSCR
2.31
1% rule
1.68%
Cash to close
$18,200
Investor read
- This is a 2-bed/1.0-bath single-family listed at $65k.
- At list price, monthly cash flow is $446 ($5k/yr) — positive.
- The deal already cash-flows at list — no discount required.
- Meets the 1% rule at list price ($1k rent vs $65k).
- Only 2 days on market — expect competitive offers; lowballing is unlikely to land.
- In year one you build about $3k of equity ($449 loan paydown + $2k appreciation (3.8% local appreciation)).
- Location reads 72/100 on livability (#86 in MO) — a middle-class / working-renter tenant base. Strengths: commute A+, cost of living A+, crime B; Watch: health & safety C-, amenities F, employment F.
- Jennings (suburban): math 8% / reading 20% proficiency, ranked #315 of 324 in MO (top 97%) — low school quality limits family demand, transient renter base, plan for 1-2y turnover; 86% free/reduced lunch — lower-income household profile, screen leases tightly.
- Zoned schools: Northview Elem. (math 3% / reading 20%, grade F, #1,022 of 1,115 statewide, top 92%, 524 students, 100% FRL); Jennings High (math 8% / reading 17%, grade F, #497 of 521 statewide, top 96%, 691 students, 100% FRL).
- Watch-outs: built in 1939 — expect roof / HVAC / electrical / plumbing capex.
- Market conditions: Rents rising fast (+5.0%/yr); 372 active listings in the ZIP; 40 comparable units currently listed for rent nearby; rentals at typical pace (median 24d on market — plan ~3-4 weeks tenant-placement turnaround); 40% of comp listings sitting > 30 days — soft ceiling on asking rent; lower-income renter base — watch delinquency; 920 units permitted in St. Louis County in 2024 (250 in 5+ unit buildings).
- Current owner paid $53k; 22% above their basis — modest negotiation headroom, anchor on the comps not their cost.
- At projected returns (3.8% appreciation + 5.0% rent growth), your $18k cash investment doubles in ~3 years — after that, you're playing with house money.
- Climate carrying-cost: extreme-heat days projected 7→21/yr by 2055 (HVAC capex compounding) — expect insurance premiums to compound above CPI over the hold.
- This rent runs 32% of the median local income ($41k/yr) — at the standard rent-burdened threshold; future hikes will face affordability resistance.
Questions for listing agent
- Built in 1939 — when were the roof, HVAC, electrical panel, plumbing, and water heater last replaced?
- Is there a deadline driving the sale (1031 exchange, divorce, estate, relocation)? That informs how much negotiation room exists.
- What's the average days-on-market for RENTAL listings here right now (not sales)? A rising rental-DOM trend means longer vacancies and softer asking-rent achievability than the comps imply.
- What's the recent tenant-quality profile in this submarket — average credit score on applications, eviction rate, late-payment / NSF rate, and stable-employment percentage? A property-management company in the area should have these aggregated.
- How much new for-sale + rental construction is in the pipeline within 1–3 miles? Heavy new supply typically softens prices + rents 12–24 months out; constrained supply supports both.
CashFlowRE · CFR-16VC32ETFZPXMK
· Data 2 days ago
cashflowre.app · 2026-05-29