158 Cider St
Bolingbrook, IL 60490
$465,000D-
4 bd · 3.0 ba ·
2,658 sqft ·
Built 1996
· Other
· Active
· 44 DOM
Cashflow @ list (25.0% down · 7.5%)
Estimated rent
$3,919/mo
Mortgage (P&I)
−$2,439
Tax + insurance
−$1,145
HOA
−$0
Vac / Maint / Mgmt
−$823
Net cashflow
$-488/mo
Annual
$-5,854/yr
Cap rate
5.03%
Cash-on-cash
-4.50%
DSCR
0.80
1% rule
0.84%
Cash to close
$130,200
Investor read
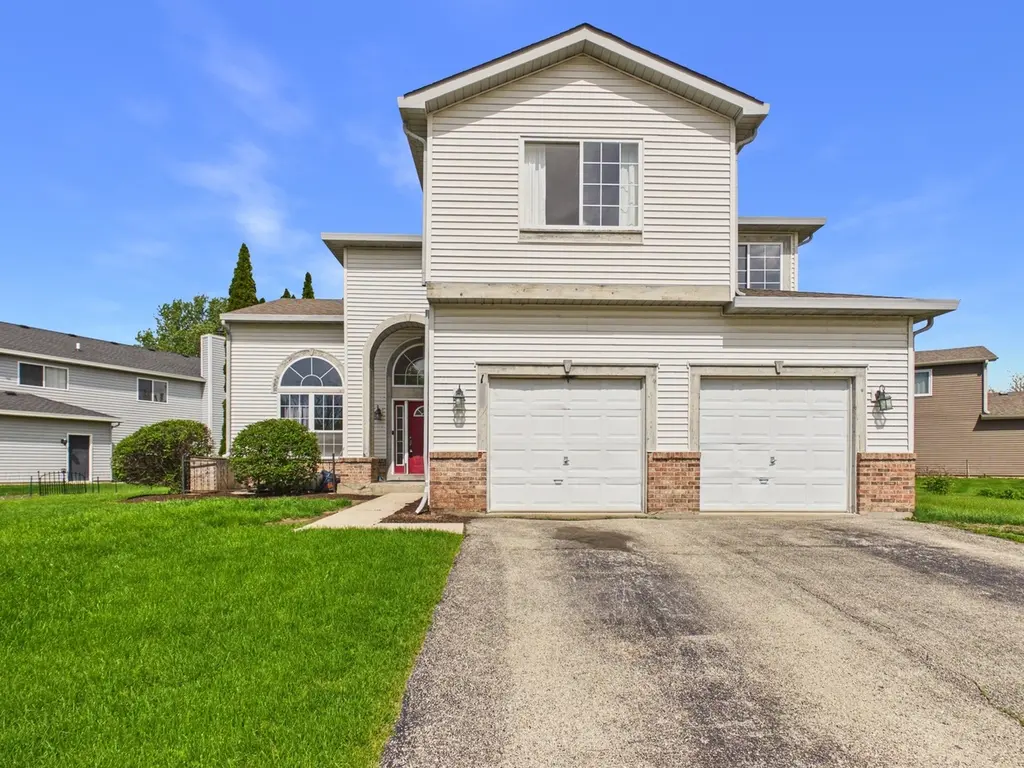
- This is a 4-bed/3.0-bath other listed at $465k.
- At list price, monthly cash flow is $-488 ($-6k/yr) — negative.
- To cash-flow at today's rent, offer at most $379k (18.5% below list).
- To meet the 1% rule (rent ≥ 1% of price), the offer needs to be $392k (15.7% below list).
- It's been on market 44 days — a 3% lower offer ($451k) is reasonable based on typical stale-listing flexibility.
- Recommended offer: $379k (18.5% below list) — sets the bar for cash-flow.
- Local home prices are declining (-3.0%/yr); year-one equity from $3k of loan paydown is wiped out by about $14k of value loss. Plan a longer hold.
- Location reads 76/100 on livability (#199 in IL, #3,692 nationally) — a middle-class / working-renter tenant base. Strengths: employment A+, housing A+, crime A; Watch: amenities F, health & safety F.
- Indian Prairie CUSD 204 (urban): math 47% / reading 47% proficiency, ranked #52 of 620 in IL (top 8%) — families likely to look elsewhere, expect single-tenant / working-renter base with shorter leases; only 13% free/reduced lunch — higher-income household profile.
- Zoned schools: Wayne Builta Elementary School (math 52% / reading 42%, grade D-, #219 of 2,056 statewide, top 12%, 278 students, 0% FRL); Gordon Gregory Middle School (math 51% / reading 56%, grade C+, #39 of 665 statewide, top 6%, 821 students, 0% FRL); Neuqua Valley High School (math 63% / reading 68%, grade B, #13 of 693 statewide, top 2%, 3,156 students, 0% FRL).
- Market conditions: 68 active listings in the ZIP; 16 comparable units currently listed for rent nearby; rentals at typical pace (median 17d on market — plan ~3-4 weeks tenant-placement turnaround); high-income renter base; 2,028 units permitted in Will County in 2024 (530 in 5+ unit buildings).
- Will County population projected to shrink 4% by 2050 — rents likely to lag national; underwrite the cash flow, not the appreciation.
- Current owner paid $256k; list at $465k implies a 82% gain — meaningful room to come down on a strong offer.
- This rent runs 31% of the median local income ($151k/yr) — at the standard rent-burdened threshold; future hikes will face affordability resistance.
Questions for listing agent
- What do current leases actually rent for vs. the listed asking? Can we see a recent rent roll and the last 12 months of T-12 income?
- It's been on market 44 days. Have you received any prior offers? Is the seller open to a 19% concession, seller financing, or rate buy-down credit?
- Is there a deadline driving the sale (1031 exchange, divorce, estate, relocation)? That informs how much negotiation room exists.
- Schools are D-rated, which usually means shorter tenancies and higher turnover. Who's the typical renter profile here, and what's been the actual vacancy rate?
- The area grade is low — what's the realistic commute time and amenity access for the typical tenant pool here? Any planned neighborhood developments (good or bad) we should know about?
- What's the average days-on-market for RENTAL listings here right now (not sales)? A rising rental-DOM trend means longer vacancies and softer asking-rent achievability than the comps imply.
- What's the recent tenant-quality profile in this submarket — average credit score on applications, eviction rate, late-payment / NSF rate, and stable-employment percentage? A property-management company in the area should have these aggregated.
- How much new for-sale + rental construction is in the pipeline within 1–3 miles? Heavy new supply typically softens prices + rents 12–24 months out; constrained supply supports both.
CashFlowRE · CFR-17K2K91XX8K6AR
· Data 18 h ago
cashflowre.app · 2026-05-29