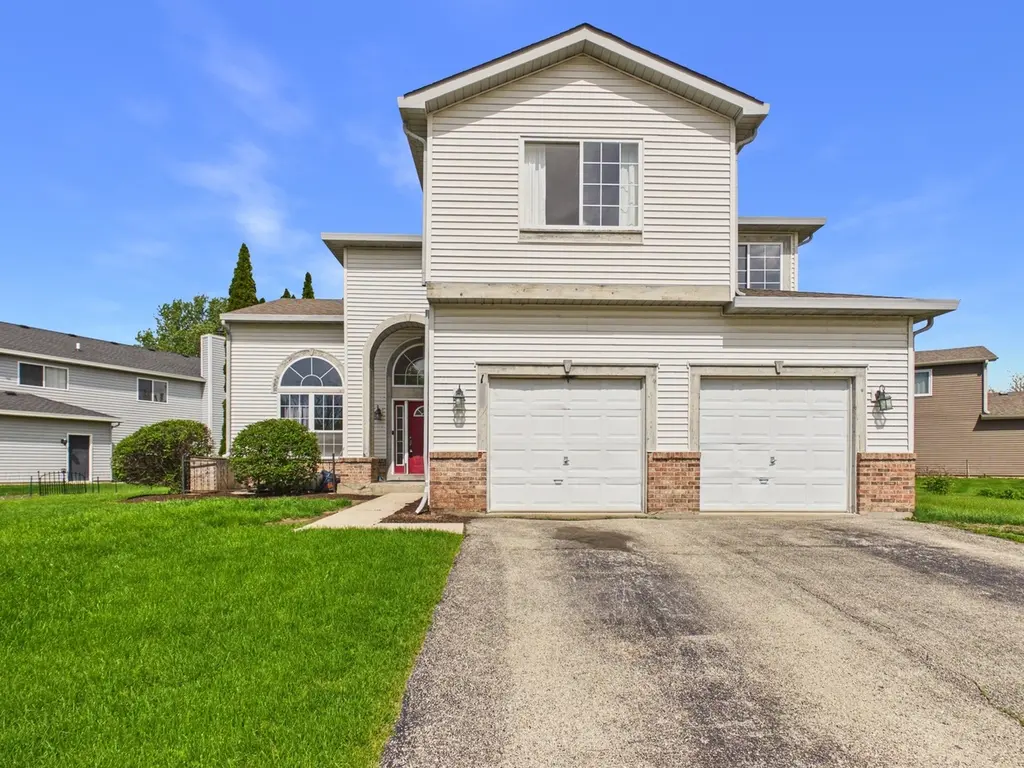
158 Cider St · Bolingbrook, IL
Flood risk 1/10 · Minimal
- FEMA flood zone
- X (unshaded)
- Chance of flooding over 30 yrs
- 0.0%
- Est. flood insurance / yr
- $507 – $1,088
Fire risk 1/10 · Minimal
- Est. fire insurance / yr
- $804 – $1,492
Heat risk 3/10 · Minor
- Hot days now (above 103°F)
- 7 days/yr
- Hot days in 30 yrs
- 15 days/yr
Wind risk 2/10 · Minimal
- Chance of severe wind over 30 yrs
- 1.0%
Air-quality risk 3/10 · Minor
- Unhealthy air days now
- 3 days/yr
- Unhealthy air days in 30 yrs
- 4 days/yr
Risk factors via First Street. Map © Google.
Why this score? — see what drove the D- grade
The composite is a weighted blend of 9 inputs, each scored 0–100. Each bar is that input's sub-score; the figure is the points it added to the 100-point composite (weight × sub-score).
- ARV discount +12.6/15.0
- Cash flow +7.9/30.0
- Schools +4.5/10.0
- Livability +3.8/5.0
- 1% rule +3.4/10.0
- Rent growth +2.5/5.0
- Condition / age +2.5/5.0
- DSCR +2.0/10.0
- Appreciation +0.0/10.0
$465,000
🖨 Deal sheet (PDF) 📄 Offer letter ✓ Due diligence
Listing remarks
Located in the highly sought after Cider Creek community on a great corner lot this home offers high vaulted ceilings, a great floor plan and equity add potential which should not be overlooked and is rarely available in this community! The main level of this home has a flowing floor plan with a formal dining room/living room, a large open kitchen which features an island and breakfast nook which opens to a spacious family room. The family room offers a fireplace which is ideal for those chilly winter nights while adding views of the tranquil yard! The second floor offers four great sized bedrooms, the master suite features a spa like bathroom with a soaking tub and large walk-in closet. Th
Key facts
- 8,784 sq ft lot
- 2 garage spots
- Built 1996
Property features AI
Finance
- Other: Property located in the Cider Creek subdivision, Bolingbrook
- HOA & community: No master association fee required
Exterior
- Parking: Attached garage (2 garage spaces, 2 total parking spaces, garage owned)
- Utilities: Public water; Public sewer; Electric with circuit breakers
- Home design: Detached single-family home; 2-story layout; Fee simple ownership
- Construction: Vinyl siding; Approximately 26–30 years old
- Exterior features: Lot dimensions approximately 72 x 122; Less than 0.25 acre lot; School bus service
Interior
- Kitchen: Kitchen on main level (20 x 8)
- Bedrooms: 4 bedrooms (master bedroom on second level; additional bedrooms on second level: 10 x 10, 11 x 10, 12 x 14)
- Bathrooms: 2 full bathrooms; 1 half bathroom
- Heating & cooling: Natural gas forced-air heating; Central air conditioning
- Interior features: Unfinished full basement; 8 total rooms
- Laundry & utility: Main-level laundry room (8 x 6)
Neighborhood map
What this means for you Summary
Snapshot
- This is a 4-bed/3.0-bath other listed at $465k.
Deal economics
- At list price, monthly cash flow is $-488 ($-6k/yr) — negative.
- To cash-flow at today's rent, offer at most $379k (18.5% below list).
- To meet the 1% rule (rent ≥ 1% of price), the offer needs to be $392k (15.7% below list).
- Recommended offer: $379k (18.5% below list) — sets the bar for cash-flow.
Location & tenants
- Location reads 76/100 on livability (#199 in IL, #3,692 nationally) — a middle-class / working-renter tenant base. Strengths: employment A+, housing A+, crime A; Watch: amenities F, health & safety F.
- Indian Prairie CUSD 204 (urban): math 47% / reading 47% proficiency, ranked #52 of 620 in IL (top 8%) — families likely to look elsewhere, expect single-tenant / working-renter base with shorter leases; only 13% free/reduced lunch — higher-income household profile.
- Zoned schools: Wayne Builta Elementary School (math 52% / reading 42%, grade D-, #219 of 2,056 statewide, top 12%, 278 students, 0% FRL); Gordon Gregory Middle School (math 51% / reading 56%, grade C+, #39 of 665 statewide, top 6%, 821 students, 0% FRL); Neuqua Valley High School (math 63% / reading 68%, grade B, #13 of 693 statewide, top 2%, 3,156 students, 0% FRL).
- Market conditions: 68 active listings in the ZIP; 16 comparable units currently listed for rent nearby; rentals at typical pace (median 17d on market — plan ~3-4 weeks tenant-placement turnaround); high-income renter base; 2,028 units permitted in Will County in 2024 (530 in 5+ unit buildings).
- This rent runs 31% of the median local income ($151k/yr) — at the standard rent-burdened threshold; future hikes will face affordability resistance.
Forward outlook
- Local home prices are declining (-3.0%/yr); year-one equity from $3k of loan paydown is wiped out by about $14k of value loss. Plan a longer hold.
- Will County population projected to shrink 4% by 2050 — rents likely to lag national; underwrite the cash flow, not the appreciation.
Negotiation context
- It's been on market 44 days — a 3% lower offer ($451k) is reasonable based on typical stale-listing flexibility.
- Current owner paid $256k; list at $465k implies a 82% gain — meaningful room to come down on a strong offer.
Questions for the listing agent
- What do current leases actually rent for vs. the listed asking? Can we see a recent rent roll and the last 12 months of T-12 income?
- It's been on market 44 days. Have you received any prior offers? Is the seller open to a 19% concession, seller financing, or rate buy-down credit?
- Is there a deadline driving the sale (1031 exchange, divorce, estate, relocation)? That informs how much negotiation room exists.
- Schools are D-rated, which usually means shorter tenancies and higher turnover. Who's the typical renter profile here, and what's been the actual vacancy rate?
- The area grade is low — what's the realistic commute time and amenity access for the typical tenant pool here? Any planned neighborhood developments (good or bad) we should know about?
- What's the average days-on-market for RENTAL listings here right now (not sales)? A rising rental-DOM trend means longer vacancies and softer asking-rent achievability than the comps imply.
- What's the recent tenant-quality profile in this submarket — average credit score on applications, eviction rate, late-payment / NSF rate, and stable-employment percentage? A property-management company in the area should have these aggregated.
- How much new for-sale + rental construction is in the pipeline within 1–3 miles? Heavy new supply typically softens prices + rents 12–24 months out; constrained supply supports both.
Investment metrics
- 1% rule
- 0.84% ✗
- Cap rate
- 5.03%
- Cash-on-cash
- -4.50%
- DSCR
- 0.80
- GRM
- 9.9
CMA / ARV
- ARV (median comp)
- $524,457
- List price
- $465,000
- Delta
- -11.34%
- Verdict
- UNDERPRICED
- Comps
- 20 within 1.0 mi
Projected returns pro-forma
-3.0% appreciation · 3.0% rent growth · sell at horizon
- IRR
- -23.8%
- Equity multiple
- 0.18×
- Total profit
- $-106,135
- Equity at exit
- $69,333
- IRR
- -18.6%
- Equity multiple
- -0.01×
- Total profit
- $-131,266
- Equity at exit
- $40,205
Cash invested: $130,200 (down + closing). Projections, not guarantees.
Landlord ↔ Tenant lean methodology
- Overall (STATE)
- 43 Moderately Tenant-Leaning
- State Illinois
- 43 Moderately Tenant-Leaning · D+7
- County
- — inherits STATE
- City
- — inherits STATE
ZIP-level market 60490
- Home prices YoY
- -24.9%
- Active inventory
- 68
- Price-to-rent
- 9.9×
Monthly cashflow live
- Estimated rent
- $3,919 high interval (Pro) →
- Mortgage (P&I)
- −$2,439
- Tax from tax record
- −$952 /mo · $11,418/yr
- Insurance
- −$194
- HOA
- −$0
- Vacancy / Maint / Mgmt
- −$823
- Net cashflow
- $-488
Break-even live
Sensitivity live
| Price | -10% $-225 | -5% $-356 | +0% $-488 | +5% $-619 | +10% $-751 |
|---|---|---|---|---|---|
| Rent | -10% $-797 | -5% $-643 | +0% $-488 | +5% $-333 | +10% $-178 |
| Rate | -1.0pp $-254 | -0.5pp $-370 | base $-488 | +0.5pp $-608 | +1.0pp $-731 |
UW: 25.0% down · 7.5% · 30yr · 1.5% tax · 5.0% vac · 8.0% maint · 8.0% mgmt
Financing live
Cash to close
- Down payment
- $116,250
- Closing costs
- $13,950
- Reserves months
- —
- Total cash needed
- —
Loan-product check · same deal, 3 products live
Conventional
25% down · 7.5% · 30yr
- Down + closing
- —
- Monthly P&I
- —
- Monthly cashflow
- —
- DSCR
- —
- Eligible?
- —
Personal DTI + credit; lowest rate.
DSCR
20% down · 8.5% · 30yr
- Down + closing
- —
- Monthly P&I
- —
- Monthly cashflow
- —
- DSCR
- —
- Eligible?
- —
No personal income docs; deal must DSCR.
Hard money
10% down · 12.0% · 12mo
- Down + closing
- —
- Monthly P&I
- —
- Monthly cashflow
- —
- DSCR
- —
- Eligible?
- —
Short-term bridge; refi at stabilization.
Rent comps 16 comps
| Address | Beds | Baths | Sqft | Rent | $/sqft | DOM | Units | Dist |
|---|---|---|---|---|---|---|---|---|
| 1925 Danube Way Bolingbrook, IL | 4.0 | 2.5 | 2600 | $3,790 | $1.46 | 45d | 1 | 0.18mi |
| 267 Silverado St Bolingbrook, IL | 3.0 | 2.0 | 2000 | $2,700 | $1.35 | 20d | 1 | 0.52mi |
| 1689 Apple Valley Rd Bolingbrook, IL | 3.0 | 2.0 | 1964 | $3,000 | $1.53 | 45d | 1 | 0.58mi |
| 1776 Alan Deatherage Dr Bolingbrook, IL | 4.0 | 3.5 | 2480 | $3,100 | $1.25 | 16d | 1 | 0.75mi |
| 1902 Barrington Ave Bolingbrook, IL | 4.0 | 2.5 | 2520 | $4,000 | $1.59 | 0d | 1 | 0.79mi |
| 346 Osage Dr Bolingbrook, IL | 4.0 | 2.5 | 3036 | $3,900 | $1.28 | 0d | 1 | 0.94mi |
| 860 Spring Creek Cir Naperville, IL | 4.0 | 2.5 | 3271 | $4,000 | $1.22 | 16d | 1 | 1.07mi |
| 668 Switchgrass Way Bolingbrook, IL | 3.0 | 2.5 | 1990 | $3,400 | $1.71 | 45d | 1 | 1.17mi |
| 668 Switchgrass Way Bolingbrook, IL | 3.0 | 2.5 | 1900 | $3,400 | $1.79 | 0d | 1 | 1.17mi |
| 659 Switchgrass Way Bolingbrook, IL | 3.0 | 2.5 | 2097 | $3,600 | $1.72 | 0d | 1 | 1.20mi |
| 2310 Ryegrass LN Bolingbrook, IL | 3.0 | 2.5 | 2536 | $3,500 | $1.38 | 21d | 1 | 1.23mi |
| 2287 Ryegrass Ln Bolingbrook, IL | 3.0 | 2.5 | 2097 | $3,400 | $1.62 | 0d | 1 | 1.26mi |
| 2227 Ryegrass Ln Bolingbrook, IL | 3.0 | 2.5 | 2097 | $3,295 | $1.57 | 13d | 1 | 1.26mi |
| 1645 Prairieview Blvd Bolingbrook, IL | 4.0 | 3.0 | 2650 | $1,750 | $0.66 | 3d | 1 | 1.31mi |
| 828 Pueblo Ct Naperville, IL | 5.0 | 3.5 | 3591 | $5,100 | $1.42 | 45d | 1 | 1.41mi |
| 1582 Manhattan St Bolingbrook, IL | 4.0 | 2.5 | 2700 | $3,300 | $1.22 | 0d | 1 | 1.44mi |
Listing history 17 events
-
2026-06-21days on market $465,000 Active 44 DOM
-
2026-06-18days on market $465,000 Active 41 DOM
-
2026-06-17days on market $465,000 Active 40 DOM
-
2026-06-16days on market $465,000 Active 39 DOM
-
2026-06-16price $465,000 Active 38 DOM
-
2026-06-15days on market $475,000 Active 38 DOM
-
2026-06-13days on market $475,000 Active 36 DOM
-
2026-06-09days on market $475,000 Active 32 DOM
-
2026-06-08days on market $475,000 Active 31 DOM
-
2026-06-07days on market $475,000 Active 30 DOM
-
2026-06-04days on market $475,000 Active 27 DOM
-
2026-06-03days on market $475,000 Active 26 DOM
-
2026-06-02days on market $475,000 Active 25 DOM
-
2026-06-01days on market $475,000 Active 24 DOM
-
2026-05-31days on market $475,000 Active 23 DOM
-
2026-05-08$475,000 Active 1140-char remark
-
2001-09-24soldstatus $256,000
ⓘ Source: listings_history table (triggers on properties + properties_extension) + one-shot
backfill from property_details.listing_events for pre-trigger history.
Tax reassessment forecast IL · Partial reset (capped growth)
- Current annual tax
- $11,418 · $952/mo
- Projected year-2 tax
- $11,418 · $952/mo
- Expected delta
- $0/yr ($0/mo · 0.0%)
ⓘ Screening estimate from a state-policy table — verify with the county assessor before closing.
Climate risk First Street
- Flood 1/10 Low FEMA zone X (unshaded) · 0% chance over 30 yrs
- Wildfire 1/10 Low
- Heat 3/10 Moderate 7 d/yr ≥103°F today · 15 d/yr by 30 yrs out
- Wind 2/10 Low 100% chance of damaging wind over 30 yrs
- Air quality 3/10 Moderate 3 unhealthy d/yr today · 4 by 30 yrs out
Nearby sold comps map
Loading sold comps map…
Walkable amenities ~0.75 mi
Loading nearby amenities…
Taxation est. · year 1
- Rental income
- $47,027
- − Mortgage interest
- −$26,047
- − Property taxes
- −$11,418
- − Insurance
- −$2,325
- − Repairs & maintenance
- −$3,762
- − Management
- −$3,762
- − Depreciation
- −$13,527
- Taxable loss
- −$13,815
- Est. tax savings @ 24.0%
- +$3,316
- After-tax cash flow
- $-2,539/yr
For passive investors: Depreciation is non-cash, so a rental often shows a tax loss while cash-flowing — sheltering income. Rental losses are passive: they offset passive income freely, and up to $25,000/yr can offset ordinary (W-2) income if you actively participate and your MAGI is under $100k (phasing out to $0 by $150k); unused losses carry forward. On sale, claimed depreciation is recaptured at up to 25%, and gains may owe capital-gains tax (a 1031 exchange can defer both). Figures are a year-1 estimate at your 24.0% rate — not tax advice; consult a CPA.
Schools (NCES district)
- District
- Indian Prairie CUSD 204
- NCES district ID
- 1741690
- Math proficiency
- 47% ▼ -10.00%
- Reading proficiency
- 47% ▼ -12.00%
- Median HH income
- $100,618
- Composite
- 45.14/100
- National rank
- #2680
- State rank
- #52 of 620 in IL
Livability — Bolingbrook
- Score
- 76/100
- State rank
- #199
- US rank
- #3692
Category grades
Schools grade is shown separately in the Schools card above.
Census & demographics
- Census place
- Bolingbrook, IL
- County
- Will County · 412,448 people
- City population
- 74,096
- Metro
- Chicago-Naperville-Elgin, IL-IN-WI
- Population (ZIP)
- 22,156
- Household income
- $150,531
- Rent vs Own
- Severe rent burden
- 213.0
Population outlook (Will County) Hauer SSP2
- Today (2025)
- 705,368 people
- By 2030
- 708,154 · +0.4%
- By 2040
- 702,692 · -0.4%
- By 2050
- 680,249 · -3.6%
- By 2075
- 611,990 · -13.2%
- By 2100
- 516,215 · -26.8%
Race, ethnicity, and origin ACS 2023
- Neighborhood character
- Highly diverse neighborhood (Simpson 0.75)
- Race & ethnicity
- White 38% Asian 23% Black 17% Hispanic / Latino 17% Two or more races 11% Native American 1%
- Hispanic origin (detail)
- Mexican 11% Puerto Rican 1%
- Common ancestry
- Romanian 5% Lithuanian 1% Italian 1%
- Foreign-born
- 21% · Canada, China, South Korea
- Languages at home
- 69% English-only · Spanish 13% Other Indo-European 7% Other Asian/Pacific 4%
Political lean MEDSL · Will
- 2024 margin
- Toss-up / Even · D 50.1% · R 48.5% · Other 1.4%
- 2008→2024 swing
- -11.6pp toward R · 2008: 13.2pp · 2024: 1.6pp
- All cycles
- 2024: D+1.6 2020: D+8.3 2016: D+5.7 2012: D+3.7 2008: D+13.2
Not yet ingested
- Civics
- —
Market trends
- HPI YoY
- ▼ -68.94%
- Current HPI
- 207.4146
- Rent YoY
- —
- Metro
- Chicago-Naperville-Elgin, IL-IN-WI
- State GDP YoY
- ▲ 1.59%
- F500 in state
- 60
Industry mix (Fortune 500 HQ in IL)
| Industry | F500 HQs | Revenue |
|---|---|---|
| Insurance | 4 | $201B |
|
||
| Consumer Goods | 4 | $87B |
|
||
| Industrial Machinery | 3 | $64B |
|
||
| Healthcare | 2 | $55B |
|
||
| Retail / Pharmacy | 1 | $148B |
|
||
| Agriculture / Food | 1 | $86B |
|
||
Price history
+81.6% since first listed3 events — show timeline
- 2026-06-15 Price Changed $465,000 MRED as Distributed by MLS Grid
- 2026-05-08 Listed $475,000 MRED as Distributed by MLS Grid
- 2001-09-24 Sold (Public Records) $256,000 Public Records
Property tax history
+3.1%/yrLatest (2024): $11,418 · +11.2% YoY. Source: county tax records.
Cash-flow waterfall
monthlySold comps — $/sqft
last 12 mo · ≤1 miLoading sold comps…