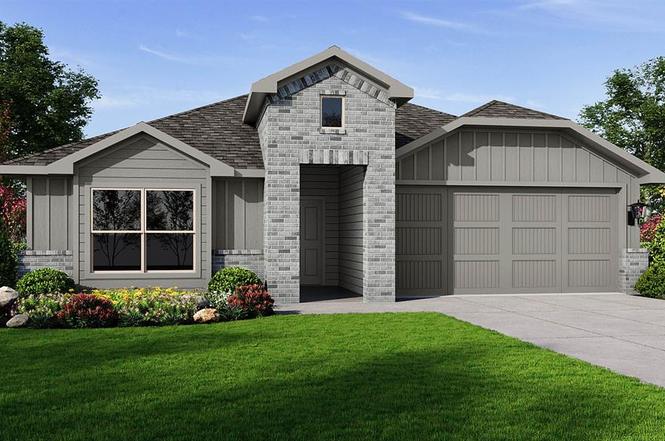
2913 Hornbill St
Denton, TX 76205
$391,685F
4 bd · 2.5 ba ·
2,036 sqft ·
Built 2026
· Land
· Pending
· 30 DOM
Cashflow @ list (25.0% down · 7.5%)
Estimated rent
$2,511/mo
Mortgage (P&I)
−$2,054
Tax + insurance
−$653
HOA
−$67
Vac / Maint / Mgmt
−$527
Net cashflow
$-791/mo
Annual
$-9,486/yr
Cap rate
3.87%
Cash-on-cash
-8.65%
DSCR
0.62
1% rule
0.64%
Cash to close
$109,672
Investor read
- This is a 4-bed/2.5-bath land listed at $392k.
- At list price, monthly cash flow is $-791 ($-9k/yr) — negative.
- To cash-flow at today's rent, offer at most $277k (29.2% below list).
- To meet the 1% rule (rent ≥ 1% of price), the offer needs to be $251k (35.9% below list).
- It's been on market 30 days — a 2% lower offer ($386k) is reasonable based on typical stale-listing flexibility.
- Recommended offer: $251k (35.9% below list) — sets the bar for 1% rule.
- Local home prices are declining (-3.0%/yr); year-one equity from $3k of loan paydown is wiped out by about $12k of value loss. Plan a longer hold.
- Location reads 88/100 on livability (#2 in TX, #210 nationally) — a professional / high-income tenant draw. Strengths: amenities A+, commute A+, housing A+.
- Denton ISD (urban): math 36% / reading 43% proficiency, ranked #383 of 826 in TX (top 46%) — families likely to look elsewhere, expect single-tenant / working-renter base with shorter leases.
- Zoned schools: Borman El (math 18% / reading 22%, grade F, #3,536 of 4,322 statewide, top 83%, 429 students, 81% FRL) — zoned schools average 81% FRL vs 38% district-wide (43 pts higher); higher-poverty schools than district average — tighter screening recommended.
- Zoned-school proficiency averages 20% at this address vs 40% district-wide (-20 pts) — the specific schools serving this property underperform the Denton ISD average; the district grade overstates school quality for this exact location.
- Market conditions: Rents falling (-3.4%/yr); 172 active listings in the ZIP; 36 comparable units currently listed for rent nearby; rentals at typical pace (median 26d on market — plan ~3-4 weeks tenant-placement turnaround); 47% of comp listings sitting > 30 days — soft ceiling on asking rent; 10,531 units permitted in Denton County in 2024 (2,713 in 5+ unit buildings).
- Denton County population projected at +66% by 2050 — long-run rental-demand tailwind backs the buy-and-hold thesis.
- This rent runs 44% of the median local income ($69k/yr) — at the standard rent-burdened threshold; future hikes will face affordability resistance.
Questions for listing agent
- What do current leases actually rent for vs. the listed asking? Can we see a recent rent roll and the last 12 months of T-12 income?
- What does the HOA fee cover, when was the last increase, and are there any pending special assessments or reserve-fund shortfalls?
- Is there a deadline driving the sale (1031 exchange, divorce, estate, relocation)? That informs how much negotiation room exists.
- Schools are B-rated — typically a magnet for longer-tenancy family renters. What's the average tenant stay here, and is there a school-zone premium baked into asking?
- The area grade is low — what's the realistic commute time and amenity access for the typical tenant pool here? Any planned neighborhood developments (good or bad) we should know about?
- What's the average days-on-market for RENTAL listings here right now (not sales)? A rising rental-DOM trend means longer vacancies and softer asking-rent achievability than the comps imply.
- What's the recent tenant-quality profile in this submarket — average credit score on applications, eviction rate, late-payment / NSF rate, and stable-employment percentage? A property-management company in the area should have these aggregated.
- How much new for-sale + rental construction is in the pipeline within 1–3 miles? Heavy new supply typically softens prices + rents 12–24 months out; constrained supply supports both.
CashFlowRE · CFR-196Z8872XJPTGN
· Data 3 weeks ago
cashflowre.app · 2026-05-29