2913 Hornbill St · Denton, TX
Flood risk No data
- FEMA flood zone
- —
- Chance of flooding over 30 yrs
- —
- Est. flood insurance / yr
- —
Fire risk No data
- Est. fire insurance / yr
- —
Heat risk No data
- Hot days now (above threshold)
- —
- Hot days in 30 yrs
- —
Wind risk No data
- Chance of severe wind over 30 yrs
- —
Air-quality risk No data
- Unhealthy air days now
- —
- Unhealthy air days in 30 yrs
- —
Risk factors via First Street. Map © Google.
Why this score? — see what drove the F grade
The composite is a weighted blend of 9 inputs, each scored 0–100. Each bar is that input's sub-score; the figure is the points it added to the 100-point composite (weight × sub-score).
- ARV discount +7.5/15.0
- Cash flow +5.8/30.0
- Livability +4.4/5.0
- Schools +3.5/10.0
- Condition / age +2.5/5.0
- Rent growth +1.7/5.0
- 1% rule +1.4/10.0
- DSCR +0.2/10.0
- Appreciation +0.0/10.0
$391,685
🖨 Deal sheet (PDF) 📄 Offer letter ✓ Due diligence
Listing remarks
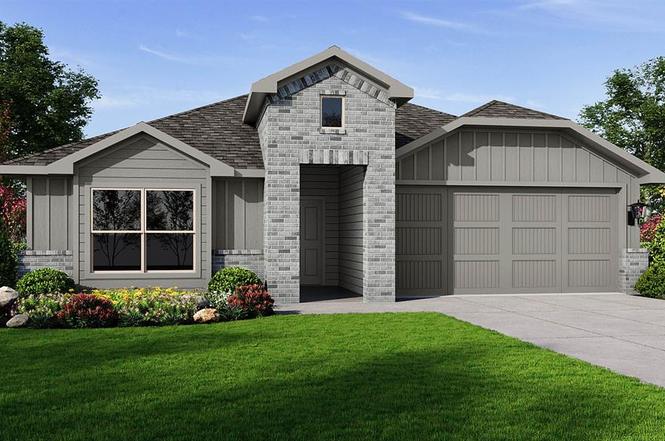
D. R. Horton is now selling in the new phase at their fabulous community of Eagle Creek in Denton and Denton ISD!! The single-story Kingston Floorplan, Elevation I, with an estimated Spring completion, offers 4 bedrooms, 2 bathrooms, and a 2-car garage, thoughtfully designed to balance open-concept living with comfortable private spaces. The heart of the home features a seamless flow between the family room, dining area, and contemporary kitchen, creating a warm and inviting environment ideal for everyday living and entertaining. The kitchen is well-appointed with quartz countertops, stainless steel Frigidaire appliances, a gas range, stainless steel sink, center island, and a walk-in pantr
Key facts
- Quartz countertops
- En-suite bath
- Open-concept living
Tags
Neighborhood map
What this means for you Summary
Snapshot
- This is a 4-bed/2.5-bath land listed at $392k.
Deal economics
- At list price, monthly cash flow is $-791 ($-9k/yr) — negative.
- To cash-flow at today's rent, offer at most $277k (29.2% below list).
- To meet the 1% rule (rent ≥ 1% of price), the offer needs to be $251k (35.9% below list).
- Recommended offer: $251k (35.9% below list) — sets the bar for 1% rule.
Location & tenants
- Location reads 88/100 on livability (#2 in TX, #210 nationally) — a professional / high-income tenant draw. Strengths: amenities A+, commute A+, housing A+.
- Denton ISD (urban): math 36% / reading 43% proficiency, ranked #383 of 826 in TX (top 46%) — families likely to look elsewhere, expect single-tenant / working-renter base with shorter leases.
- Zoned schools: Borman El (math 18% / reading 22%, grade F, #3,536 of 4,322 statewide, top 83%, 429 students, 81% FRL) — zoned schools average 81% FRL vs 38% district-wide (43 pts higher); higher-poverty schools than district average — tighter screening recommended.
- Zoned-school proficiency averages 20% at this address vs 40% district-wide (-20 pts) — the specific schools serving this property underperform the Denton ISD average; the district grade overstates school quality for this exact location.
- Market conditions: Rents falling (-3.4%/yr); 172 active listings in the ZIP; 36 comparable units currently listed for rent nearby; rentals at typical pace (median 26d on market — plan ~3-4 weeks tenant-placement turnaround); 47% of comp listings sitting > 30 days — soft ceiling on asking rent; 10,531 units permitted in Denton County in 2024 (2,713 in 5+ unit buildings).
- This rent runs 44% of the median local income ($69k/yr) — at the standard rent-burdened threshold; future hikes will face affordability resistance.
Forward outlook
- Local home prices are declining (-3.0%/yr); year-one equity from $3k of loan paydown is wiped out by about $12k of value loss. Plan a longer hold.
- Denton County population projected at +66% by 2050 — long-run rental-demand tailwind backs the buy-and-hold thesis.
Negotiation context
- It's been on market 30 days — a 2% lower offer ($386k) is reasonable based on typical stale-listing flexibility.
Questions for the listing agent
- What do current leases actually rent for vs. the listed asking? Can we see a recent rent roll and the last 12 months of T-12 income?
- What does the HOA fee cover, when was the last increase, and are there any pending special assessments or reserve-fund shortfalls?
- Is there a deadline driving the sale (1031 exchange, divorce, estate, relocation)? That informs how much negotiation room exists.
- Schools are B-rated — typically a magnet for longer-tenancy family renters. What's the average tenant stay here, and is there a school-zone premium baked into asking?
- The area grade is low — what's the realistic commute time and amenity access for the typical tenant pool here? Any planned neighborhood developments (good or bad) we should know about?
- What's the average days-on-market for RENTAL listings here right now (not sales)? A rising rental-DOM trend means longer vacancies and softer asking-rent achievability than the comps imply.
- What's the recent tenant-quality profile in this submarket — average credit score on applications, eviction rate, late-payment / NSF rate, and stable-employment percentage? A property-management company in the area should have these aggregated.
- How much new for-sale + rental construction is in the pipeline within 1–3 miles? Heavy new supply typically softens prices + rents 12–24 months out; constrained supply supports both.
Investment metrics
- 1% rule
- 0.64% ✗
- Cap rate
- 3.87%
- Cash-on-cash
- -8.65%
- DSCR
- 0.62
- GRM
- 13.0
CMA / ARV
No comps found within radius.
Projected returns pro-forma
-3.0% appreciation · 0.0% rent growth · sell at horizon
- IRR
- -35.0%
- Equity multiple
- -0.10×
- Total profit
- $-121,096
- Equity at exit
- $58,402
- IRR
- -69.7%
- Equity multiple
- -0.81×
- Total profit
- $-198,392
- Equity at exit
- $33,866
Cash invested: $109,672 (down + closing). Projections, not guarantees.
Landlord ↔ Tenant lean methodology
- Overall (STATE)
- 87 Strongly Landlord-Friendly
- State Texas
- 87 Strongly Landlord-Friendly · R+5
- County
- — inherits STATE
- City
- — inherits STATE
ZIP-level market 76205
- Home prices YoY
- -25.8%
- Rents YoY
- -3.4%
- Active inventory
- 172
- Price-to-rent
- 13.0×
Monthly cashflow live
- Estimated rent
- $2,511 high interval (Pro) →
- Mortgage (P&I)
- −$2,054
- Tax est. 1.5%
- −$490 /mo · $5,875/yr
- Insurance
- −$163
- HOA
- −$67
- Vacancy / Maint / Mgmt
- −$527
- Net cashflow
- $-791
Break-even live
Sensitivity live
| Price | -10% $-520 | -5% $-655 | +0% $-791 | +5% $-926 | +10% $-1,061 |
|---|---|---|---|---|---|
| Rent | -10% $-989 | -5% $-890 | +0% $-791 | +5% $-691 | +10% $-592 |
| Rate | -1.0pp $-593 | -0.5pp $-691 | base $-791 | +0.5pp $-892 | +1.0pp $-995 |
UW: 25.0% down · 7.5% · 30yr · 1.5% tax · 5.0% vac · 8.0% maint · 8.0% mgmt
Financing live
Cash to close
- Down payment
- $97,921
- Closing costs
- $11,751
- Reserves months
- —
- Total cash needed
- —
Loan-product check · same deal, 3 products live
Conventional
25% down · 7.5% · 30yr
- Down + closing
- —
- Monthly P&I
- —
- Monthly cashflow
- —
- DSCR
- —
- Eligible?
- —
Personal DTI + credit; lowest rate.
DSCR
20% down · 8.5% · 30yr
- Down + closing
- —
- Monthly P&I
- —
- Monthly cashflow
- —
- DSCR
- —
- Eligible?
- —
No personal income docs; deal must DSCR.
Hard money
10% down · 12.0% · 12mo
- Down + closing
- —
- Monthly P&I
- —
- Monthly cashflow
- —
- DSCR
- —
- Eligible?
- —
Short-term bridge; refi at stabilization.
Rent comps 36 comps
| Address | Beds | Baths | Sqft | Rent | $/sqft | DOM | Units | Dist |
|---|---|---|---|---|---|---|---|---|
| 1709 Sparrow St Denton, TX | 5.0 | 4.0 | 2922 | $3,300 | $1.13 | 0d | 1 | 0.18mi |
| 1513 Woodpecker St Denton, TX | 4.0 | 3.0 | 2733 | $3,500 | $1.28 | 12d | 1 | 0.25mi |
| 2605 Starling St Denton, TX | 5.0 | 3.0 | 2150 | $2,850 | $1.33 | 0d | 1 | 0.29mi |
| 2301 Ruff Rd Denton, TX | 4.0 | 2.0 | 1914 | $2,700 | $1.41 | 26d | 1 | 0.43mi |
| 2201 Yellowhammer Rd Denton, TX | 4.0 | 3.0 | 2874 | $3,150 | $1.10 | 26d | 1 | 0.49mi |
| 2704 Donella Dr Denton, TX | 4.0 | 2.0 | 1901 | $2,500 | $1.32 | 45d | 1 | 0.57mi |
| 2200 Laurel St Denton, TX | 3.0 | 2.0 | 1444 | $2,195 | $1.52 | 45d | 1 | 0.72mi |
| 1403 Kendolph Dr Denton, TX | 3.0 | 2.0 | 1967 | $2,975 | $1.51 | 4d | 1 | 1.04mi |
| 3108 Spenrock Ct Denton, TX | 4.0 | 2.5 | 2124 | $2,200 | $1.04 | 46d | 1 | 1.09mi |
| 3117 Kappwood Ct Denton, TX | 4.0 | 2.5 | 1887 | $2,125 | $1.13 | 4d | 1 | 1.11mi |
| 3117 Kappwood Ct Denton, TX | 4.0 | 2.5 | 1887 | $2,125 | $1.13 | 18d | 1 | 1.11mi |
| 3100 Hornbeam St Argyle, TX | 3.0 | 2.5 | 2572 | $2,550 | $0.99 | 45d | 1 | 1.13mi |
| 1324 Norman St Denton, TX | 4.0 | 2.0 | 1600 | $1,895 | $1.18 | 45d | 1 | 1.17mi |
| 3121 Hornbeam St Argyle, TX | 3.0 | 2.0 | 1852 | $2,399 | $1.30 | 4d | 1 | 1.19mi |
| 4512 Remuda Ln Argyle, TX | 3.0 | 2.0 | 1737 | $2,300 | $1.32 | 45d | 1 | 1.22mi |
| 1112 Beechwood Dr Denton, TX | 4.0 | 2.5 | 1606 | $2,405 | $1.50 | 45d | 1 | 1.25mi |
| 3128 Buckthorn Ln Argyle, TX | 3.0 | 2.0 | 1845 | $2,395 | $1.30 | 45d | 1 | 1.26mi |
| 1105 Neff St Denton, TX | 4.0 | 2.0 | 1400 | $2,099 | $1.50 | 45d | 1 | 1.27mi |
| 1103 Neff St Denton, TX | 4.0 | 2.0 | 1600 | $2,099 | $1.31 | 45d | 1 | 1.28mi |
| 1007 W Collins St Denton, TX | 4.0 | 2.0 | 1696 | $1,850 | $1.09 | 20d | 1 | 1.28mi |
| 1029 Beechwood Dr Denton, TX | 4.0 | 2.5 | 2105 | $2,200 | $1.05 | 45d | 1 | 1.29mi |
| 1120 Springcreek Dr Denton, TX | 4.0 | 2.5 | 2698 | $2,370 | $0.88 | 14d | 1 | 1.30mi |
| 3312 Stonecrop Trl Argyle, TX | 3.0 | 2.0 | 1737 | $2,200 | $1.27 | 26d | 1 | 1.31mi |
| 1009 Springcreek Dr Denton, TX | 4.0 | 2.0 | 1467 | $1,970 | $1.34 | 22d | 1 | 1.36mi |
| 1001 Springcreek Dr Denton, TX | 4.0 | 2.0 | 1515 | $2,235 | $1.48 | 1d | 1 | 1.36mi |
| 4505 Merlot Dr Argyle, TX | 4.0 | 2.5 | 2353 | $2,350 | $1.00 | 45d | 1 | 1.37mi |
| 5200 Woodway Dr Argyle, TX | 4.0 | 3.0 | 2129 | $2,600 | $1.22 | 6d | 1 | 1.42mi |
| 5200 Woodway Dr Argyle, TX | 4.0 | 3.0 | 2129 | $2,900 | $1.36 | 45d | 1 | 1.42mi |
| 101 Daugherty St Denton, TX | 4.0 | 4.0 | 1458 | $694 | $0.48 | 45d | 1 | 1.43mi |
| 3401 Aaron Pl Argyle, TX | 3.0 | 2.5 | 1922 | $2,500 | $1.30 | 45d | 1 | 1.43mi |
| 3413 Aaron Pl Argyle, TX | 3.0 | 2.5 | 1684 | $2,250 | $1.34 | 19d | 1 | 1.44mi |
| 3600 Aaron Pl Argyle, TX | 3.0 | 2.5 | 1866 | $2,350 | $1.26 | 19d | 1 | 1.44mi |
| 3612 Aaron Pl Argyle, TX | 3.0 | 2.5 | 1684 | $2,350 | $1.40 | 45d | 1 | 1.45mi |
| 5108 Middlestone Ln Argyle, TX | 4.0 | 2.0 | 1913 | $2,750 | $1.44 | 9d | 1 | 1.46mi |
| 3621 Bonnie Brae St Unit 3621 Argyle, TX | 3.0 | 2.5 | 1866 | $2,195 | $1.18 | 45d | 1 | 1.47mi |
| 3329 Tamarack Ln Argyle, TX | 4.0 | 2.0 | 1994 | $2,600 | $1.30 | 19d | 1 | 1.48mi |
HOA detail
- Monthly dues
- $67 · $804/yr
- Likely covers
- gas
Listing history 2 events
-
2026-02-27status Pending
-
2026-01-28$391,685 Active
ⓘ Source: listings_history table (triggers on properties + properties_extension) + one-shot
backfill from property_details.listing_events for pre-trigger history.
Nearby sold comps map
Loading sold comps map…
Walkable amenities ~0.75 mi
Loading nearby amenities…
Taxation est. · year 1
- Rental income
- $30,127
- − Mortgage interest
- −$21,940
- − Property taxes
- −$5,875
- − Insurance
- −$1,958
- − Repairs & maintenance
- −$2,410
- − Management
- −$2,410
- − HOA
- −$804
- − Depreciation
- −$11,394
- Taxable loss
- −$16,666
- Est. tax savings @ 24.0%
- +$4,000
- After-tax cash flow
- $-5,486/yr
For passive investors: Depreciation is non-cash, so a rental often shows a tax loss while cash-flowing — sheltering income. Rental losses are passive: they offset passive income freely, and up to $25,000/yr can offset ordinary (W-2) income if you actively participate and your MAGI is under $100k (phasing out to $0 by $150k); unused losses carry forward. On sale, claimed depreciation is recaptured at up to 25%, and gains may owe capital-gains tax (a 1031 exchange can defer both). Figures are a year-1 estimate at your 24.0% rate — not tax advice; consult a CPA.
Schools (NCES district)
- District
- Denton ISD
- NCES district ID
- 4816740
- Math proficiency
- 36% ▼ -18.00%
- Reading proficiency
- 43% ▼ -9.00%
- Median HH income
- $58,913
- Composite
- 34.91/100
- National rank
- #5075
- State rank
- #383 of 826 in TX
Livability — Denton
- Score
- 88/100
- State rank
- #2
- US rank
- #210
Category grades
Schools grade is shown separately in the Schools card above.
Census & demographics
- Census place
- Denton, TX
- County
- Denton County · 901,654 people
- City population
- 127,990
- Metro
- Dallas-Fort Worth-Arlington, TX
- Population (ZIP)
- 18,978
- Household income
- $68,600
- Rent vs Own
- Severe rent burden
- 1268.0
Population outlook (Denton County) Hauer SSP2
- Today (2025)
- 1,053,010 people
- By 2030
- 1,192,269 · +13.2%
- By 2040
- 1,472,920 · +39.9%
- By 2050
- 1,746,506 · +65.9%
- By 2075
- 2,358,497 · +124.0%
- By 2100
- 2,779,183 · +163.9%
Race, ethnicity, and origin ACS 2023
- Neighborhood character
- Diverse neighborhood (Simpson 0.67)
- Race & ethnicity
- White 49% Hispanic / Latino 26% Two or more races 18% Black 17% Asian 2%
- Hispanic origin (detail)
- Mexican 24%
- Common ancestry
- Italian 3% Slovak 2% Lithuanian 2%
- Foreign-born
- 17% · Canada, China
- Languages at home
- 76% English-only · Spanish 18% Arabic 3% Other Indo-European 1%
Political lean MEDSL · Denton
- 2024 margin
- R (+13.2) · D 42.7% · R 55.8% · Other 1.5%
- 2008→2024 swing
- +11.0pp toward D · 2008: -24.2pp · 2024: -13.2pp
- All cycles
- 2024: R+13.2 2020: R+8.1 2016: R+20.2 2012: R+31.7 2008: R+24.2
Not yet ingested
- Civics
- —
Market trends
- HPI YoY
- ▼ -101.13%
- Current HPI
- 290.7883
- Rent YoY
- ▼ -3.40%
- Metro
- Dallas-Fort Worth-Arlington, TX
- State GDP YoY
- ▲ 3.95%
- F500 in state
- 110
Industry mix (Fortune 500 HQ in TX)
| Industry | F500 HQs | Revenue |
|---|---|---|
| Energy | 16 | $1,198B |
|
||
| Technology | 5 | $198B |
|
||
| Engineering / Construction | 4 | $72B |
|
||
| Energy Services | 3 | $60B |
|
||
| Utilities | 3 | $41B |
|
||
| Healthcare | 2 | $330B |
|
||
Price history
2 events — show timeline
- 2026-02-27 Pending — NTREIS
- 2026-01-28 Listed $391,685 NTREIS
Property tax history
-13.4%/yrLatest (2025): $318 · +23.6% YoY. Source: county tax records.
Cash-flow waterfall
monthlySold comps — $/sqft
last 12 mo · ≤1 miLoading sold comps…