Portfolio 4 Properties W Jackson St
Gaithersburg, MD 17401
$600,000B
21 bd · 6.3 ba ·
10,538 sqft ·
Built 1900
· MultiFamily
· Pending
· 5 DOM
Cashflow @ list (25.0% down · 7.5%)
Estimated rent
$20,091/mo
Mortgage (P&I)
−$3,146
Tax + insurance
−$1,000
HOA
−$0
Vac / Maint / Mgmt
−$4,219
Net cashflow
$11,725/mo
Annual
$140,705/yr
Cap rate
29.74%
Cash-on-cash
83.75%
DSCR
4.73
1% rule
3.35%
Cash to close
$168,000
Investor read
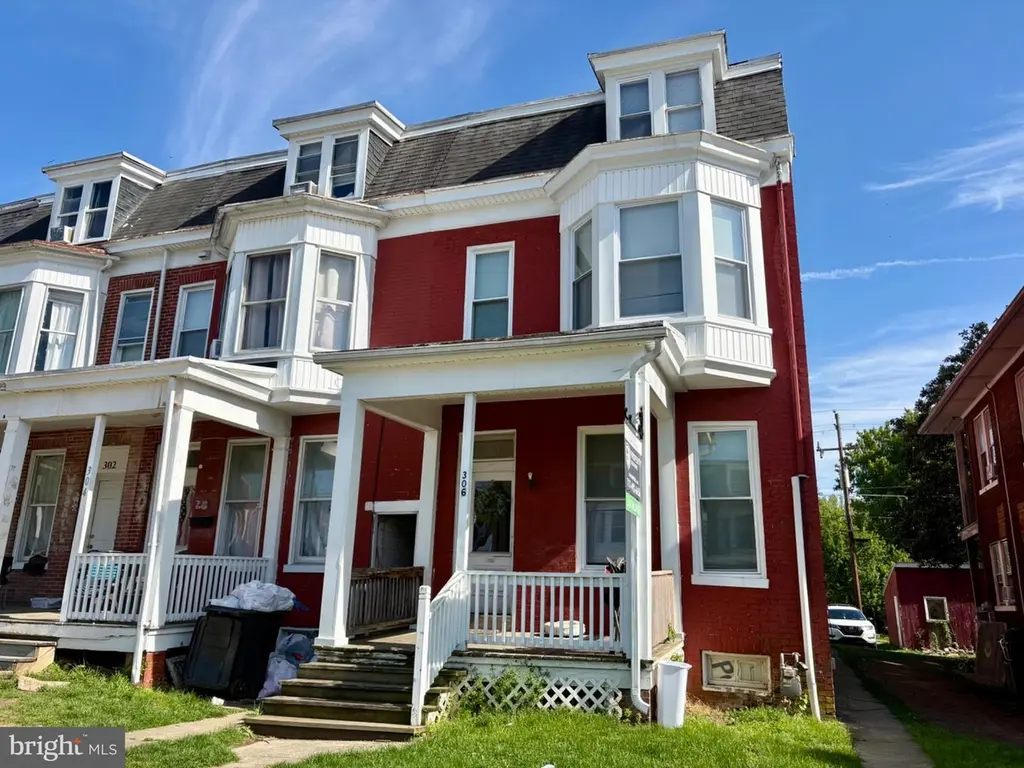
- This is a 7 × 3-bed/0.9-bath units multifamily listed at $600k. Condition is rated fair.
- At list price, monthly cash flow is $12k ($141k/yr) — positive. Per door: $2k/mo.
- The deal already cash-flows at list — no discount required.
- Meets the 1% rule at list price ($20k rent vs $600k).
- Only 5 days on market — expect competitive offers; lowballing is unlikely to land.
- Local home prices are declining (-3.0%/yr); year-one equity from $4k of loan paydown is wiped out by about $18k of value loss. Plan a longer hold.
- Location reads 79/100 on livability (#59 in MD, #2,228 nationally) — a middle-class / working-renter tenant base. Strengths: commute A+, employment A+, housing A+; Watch: cost of living F.
- Montgomery County Public Schools (suburban): math 27% / reading 45% proficiency, ranked #3 of 24 in MD (top 12%) — families likely to look elsewhere, expect single-tenant / working-renter base with shorter leases.
- Watch-outs: built in 1900 — expect roof / HVAC / electrical / plumbing capex.
- Market conditions: Rents rising fast (+6.4%/yr); 1 active listings in the ZIP; lower-income renter base — watch delinquency; 3,880 units permitted in Montgomery County in 2024 (2,054 in 5+ unit buildings).
- Montgomery County population projected at +27% by 2050 — long-run rental-demand tailwind backs the buy-and-hold thesis.
- At projected returns (-3.0% appreciation + 6.4% rent growth), your $168k cash investment doubles in ~2 years — after that, you're playing with house money.
- Cap rate 29.7% vs local median 3.0% in Gaithersburg — top-decile yield for the area; either an underpriced asset or a hidden risk that comps aren't pricing in. Stress-test before assuming the spread holds.
- At $20,091/mo this rent would consume 563% of the median local household income ($43k/yr) (locally 1360% of renters already pay >50% of income on rent) — very limited rent-growth headroom before tenants either downsize or default.
Questions for listing agent
- Can we see the unit-by-unit rent roll, current vacancy, and any below-market leases? What's the average tenancy length?
- What capital expenditures (roof, boiler, parking lot, exteriors) have been made in the last 5 years, and what's planned in the next 2?
- Have any recent inspections been done? Can we get a copy of the seller's disclosures and any deferred-maintenance estimates?
- Built in 1900 — when were the roof, HVAC, electrical panel, plumbing, and water heater last replaced?
- Is there a deadline driving the sale (1031 exchange, divorce, estate, relocation)? That informs how much negotiation room exists.
- What's the average days-on-market for RENTAL listings here right now (not sales)? A rising rental-DOM trend means longer vacancies and softer asking-rent achievability than the comps imply.
- What's the recent tenant-quality profile in this submarket — average credit score on applications, eviction rate, late-payment / NSF rate, and stable-employment percentage? A property-management company in the area should have these aggregated.
- How much new apartment / multifamily construction is in the pipeline within 1–3 miles? Heavy new supply (>2% of stock underway) typically softens rents 12–24 months out; light construction supports rent growth.
Repairs flagged (vision-AI assessment)
- Major: exterior siding — Significant peeling and wear
- Major: interior walls — Peeling paint and visible wear
- Major: flooring — Worn carpets and visible wear
CashFlowRE · CFR-1992D6CDFHE270
· Data 2 weeks ago
cashflowre.app · 2026-05-29