 7-Plex
Portfolio 4 Properties W Jackson St · Gaithersburg, MD
Flood risk No data
- FEMA flood zone
- —
- Chance of flooding over 30 yrs
- —
- Est. flood insurance / yr
- —
Fire risk No data
- Est. fire insurance / yr
- —
Heat risk No data
- Hot days now (above threshold)
- —
- Hot days in 30 yrs
- —
Wind risk No data
- Chance of severe wind over 30 yrs
- —
Air-quality risk No data
- Unhealthy air days now
- —
- Unhealthy air days in 30 yrs
- —
Risk factors via First Street. Map © Google.
Why this score? — see what drove the B grade
The composite is a weighted blend of 9 inputs, each scored 0–100. Each bar is that input's sub-score; the figure is the points it added to the 100-point composite (weight × sub-score).
- Cash flow +30.0/30.0
- 1% rule +10.0/10.0
- DSCR +10.0/10.0
- ARV discount +7.5/15.0
- Rent growth +4.1/5.0
- Livability +4.0/5.0
- Schools +3.6/10.0
- Condition / age +2.2/5.0
- Appreciation +0.0/10.0
$600,000
🖨 Deal sheet 📄 Offer letter ✓ Due diligence
Multi-family units
County records classify this as Multi-Family (2-4 Unit). Listing-text estimate: 7 units. estimate disagrees with records
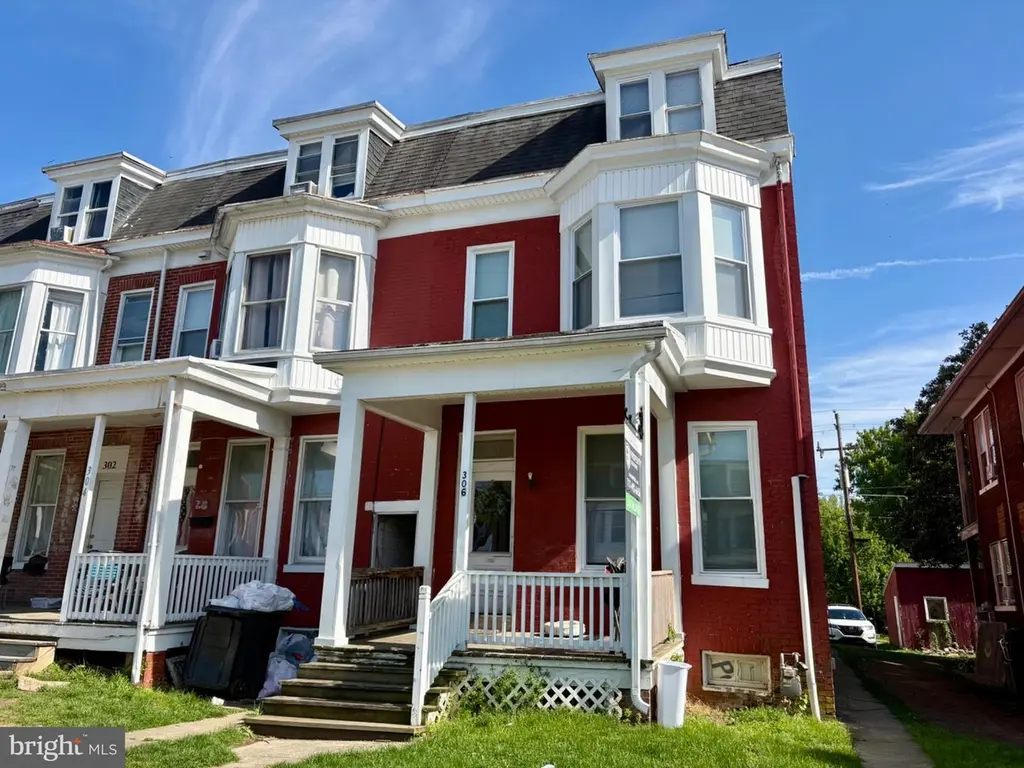
Listing remarks
Don’t miss this exceptional opportunity to own 4 versatile, income-producing properties just minutes from York College. These spacious homes have a total of 22 rooms and are licensed as student housing/boarding making it ideal for a variety of high-demand rental uses. Two properties are occupied and two are vacant and rent ready. These properties offer a turnkey opportunity with great income potential.
Key facts
- Turnkey opportunity
- Built 1900
- Listed 5 days
Tags
Property features AI
Finance
- Financial info: Total of 4 units in the building; 22 single-room units total with 4 currently leased
Exterior
- Parking: Off-street parking
- Utilities: Natural gas service
- Home design: Interior townhouse/rowhouse style; Fee simple ownership
- Construction: Brick construction; Built year estimated; Slab foundation
- Exterior features: Above-grade structures; Public water; Public sewer
Interior
- Bedrooms: Contains 22 single-room units (multi-unit property)
- Heating & cooling: Forced air heating; Natural gas hot water
- Interior features: Unfinished basement
Neighborhood map
What this means for you Summary
Snapshot
- This is a 7 × 3-bed/0.9-bath units multifamily listed at $600k. Condition is rated fair.
Deal economics
- At list price, monthly cash flow is $12k ($141k/yr) — positive. Per door: $2k/mo.
- The deal already cash-flows at list — no discount required.
- Meets the 1% rule at list price ($20k rent vs $600k).
- Cap rate 29.7% vs local median 3.0% in Gaithersburg — top-decile yield for the area; either an underpriced asset or a hidden risk that comps aren't pricing in. Stress-test before assuming the spread holds.
Location & tenants
- Location reads 79/100 on livability (#59 in MD, #2,228 nationally) — a middle-class / working-renter tenant base. Strengths: commute A+, employment A+, housing A+; Watch: cost of living F.
- Montgomery County Public Schools (suburban): math 27% / reading 45% proficiency, ranked #3 of 24 in MD (top 12%) — families likely to look elsewhere, expect single-tenant / working-renter base with shorter leases.
- Market conditions: Rents rising fast (+6.4%/yr); 1 active listings in the ZIP; lower-income renter base — watch delinquency; 3,880 units permitted in Montgomery County in 2024 (2,054 in 5+ unit buildings).
- At $20,091/mo this rent would consume 563% of the median local household income ($43k/yr) (locally 1360% of renters already pay >50% of income on rent) — very limited rent-growth headroom before tenants either downsize or default.
Forward outlook
- Local home prices are declining (-3.0%/yr); year-one equity from $4k of loan paydown is wiped out by about $18k of value loss. Plan a longer hold.
- Montgomery County population projected at +27% by 2050 — long-run rental-demand tailwind backs the buy-and-hold thesis.
- At projected returns (-3.0% appreciation + 6.4% rent growth), your $168k cash investment doubles in ~2 years — after that, you're playing with house money.
Negotiation context
- Only 5 days on market — expect competitive offers; lowballing is unlikely to land.
Risks & watch-outs
- Watch-outs: built in 1900 — expect roof / HVAC / electrical / plumbing capex.
Questions for the listing agent
- Can we see the unit-by-unit rent roll, current vacancy, and any below-market leases? What's the average tenancy length?
- What capital expenditures (roof, boiler, parking lot, exteriors) have been made in the last 5 years, and what's planned in the next 2?
- Have any recent inspections been done? Can we get a copy of the seller's disclosures and any deferred-maintenance estimates?
- Built in 1900 — when were the roof, HVAC, electrical panel, plumbing, and water heater last replaced?
- Is there a deadline driving the sale (1031 exchange, divorce, estate, relocation)? That informs how much negotiation room exists.
- What's the average days-on-market for RENTAL listings here right now (not sales)? A rising rental-DOM trend means longer vacancies and softer asking-rent achievability than the comps imply.
- What's the recent tenant-quality profile in this submarket — average credit score on applications, eviction rate, late-payment / NSF rate, and stable-employment percentage? A property-management company in the area should have these aggregated.
- How much new apartment / multifamily construction is in the pipeline within 1–3 miles? Heavy new supply (>2% of stock underway) typically softens rents 12–24 months out; light construction supports rent growth.
Investment metrics
- 1% rule
- 3.35% ✓
- Cap rate
- 29.74%
- Cash-on-cash
- 83.75%
- DSCR
- 4.73
- GRM
- 2.5
CMA / ARV
No comps found within radius.
Projected returns pro-forma
-3.0% appreciation · 6.37% rent growth · sell at horizon
- IRR
- 87.9%
- Equity multiple
- 5.29×
- Total profit
- $720,299
- Equity at exit
- $89,462
- IRR
- 91.7%
- Equity multiple
- 12.31×
- Total profit
- $1,899,814
- Equity at exit
- $51,877
Cash invested: $168,000 (down + closing). Projections, not guarantees.
Landlord ↔ Tenant lean methodology
- Overall (STATE)
- 27 Tenant-Leaning
- State Maryland
- 27 Tenant-Leaning · D+14
- County
- — inherits STATE
- City
- — inherits STATE
ZIP-level market 17401
- Home prices YoY
- -16.5%
- Rents YoY
- 6.4%
- Active inventory
- 1
- Price-to-rent
- 17.4×
Monthly cashflow live
- Estimated rent
- $20,091 high interval (Pro) →
- Mortgage (P&I)
- −$3,146
- Tax est. 1.5%
- −$750 /mo · $9,000/yr
- Insurance
- −$250
- HOA
- −$0
- Vacancy / Maint / Mgmt
- −$4,219
- Net cashflow
- $11,725
Break-even live
7-unit breakdown (identical units grouped — click to expand)
| Units | Beds | Baths | Est. rent |
|---|---|---|---|
| 7× units | 3 | 0.9 | $20,090 |
| #1 | 3 | 0.9 | $2,870 |
| #2 | 3 | 0.9 | $2,870 |
| #3 | 3 | 0.9 | $2,870 |
| #4 | 3 | 0.9 | $2,870 |
| #5 | 3 | 0.9 | $2,870 |
| #6 | 3 | 0.9 | $2,870 |
| #7 | 3 | 0.9 | $2,870 |
| Total (7 units) | $20,091 | ||
UW: 25.0% down · 7.5% · 30yr · 1.5% tax · 5.0% vac · 8.0% maint · 8.0% mgmt
Financing live
Cash to close
- Down payment
- $150,000
- Closing costs
- $18,000
- Reserves months
- —
- Total cash needed
- —
Loan-product check · same deal, 3 products live
Conventional
25% down · 7.5% · 30yr
- Down + closing
- —
- Monthly P&I
- —
- Monthly cashflow
- —
- DSCR
- —
- Eligible?
- —
Personal DTI + credit; lowest rate.
DSCR
20% down · 8.5% · 30yr
- Down + closing
- —
- Monthly P&I
- —
- Monthly cashflow
- —
- DSCR
- —
- Eligible?
- —
No personal income docs; deal must DSCR.
Hard money
10% down · 12.0% · 12mo
- Down + closing
- —
- Monthly P&I
- —
- Monthly cashflow
- —
- DSCR
- —
- Eligible?
- —
Short-term bridge; refi at stabilization.
Listing history 2 events
-
2026-05-09status Pending 411-char remark
-
2026-05-04$600,000 Active 411-char remark
ⓘ Source: listings_history table (triggers on properties + properties_extension) + one-shot
backfill from property_details.listing_events for pre-trigger history.
Nearby sold comps map
Loading sold comps map…
Walkable amenities ~0.75 mi
Loading nearby amenities…
Taxation est. · year 1
- Rental income
- $241,092
- − Mortgage interest
- −$33,609
- − Property taxes
- −$9,000
- − Insurance
- −$3,000
- − Repairs & maintenance
- −$19,287
- − Management
- −$19,287
- − Depreciation
- −$17,455
- Taxable income
- $139,453
- Est. tax owed @ 24.0%
- −$33,469
- After-tax cash flow
- $107,236/yr
For passive investors: Depreciation is non-cash, so a rental often shows a tax loss while cash-flowing — sheltering income. Rental losses are passive: they offset passive income freely, and up to $25,000/yr can offset ordinary (W-2) income if you actively participate and your MAGI is under $100k (phasing out to $0 by $150k); unused losses carry forward. On sale, claimed depreciation is recaptured at up to 25%, and gains may owe capital-gains tax (a 1031 exchange can defer both). Figures are a year-1 estimate at your 24.0% rate — not tax advice; consult a CPA.
Condition & rehab AI · 4 photos
This multi-family property requires moderate renovations to improve its exterior and interior conditions, enhancing its resale and rental value.
Repairs flagged
- Major exterior siding — Significant peeling and wear
- Major interior walls — Peeling paint and visible wear
- Major flooring — Worn carpets and visible wear
Value-add opportunities
- Both Paint exterior siding — Enhances curb appeal and property value
- Both Paint interior walls — Improves interior appearance and rental appeal
- Both Replace worn carpets — Enhances comfort and rental appeal
Renovation cost estimate screening
| Repair item | Severity | Est. cost |
|---|---|---|
| exterior siding · Significant peeling and wear | Major | $15,000–50,000 |
| interior walls · Peeling paint and visible wear | Major | $15,000–50,000 |
| flooring · Worn carpets and visible wear | Major | $15,000–50,000 |
| Total estimated repair cost · 3 items | $45,000–150,000 |
Value-add ROI direction
- Both Paint exterior siding — Enhances curb appeal and property value ↑
- Both Paint interior walls — Improves interior appearance and rental appeal ↑
- Both Replace worn carpets — Enhances comfort and rental appeal ↑
ⓘ Cost ranges are severity-bucket heuristics (US national rule-of-thumb). Get contractor quotes + a written scope before underwriting a rehab budget.
Schools (NCES district)
- District
- Montgomery County Public Schools
- NCES district ID
- 2400480
- Math proficiency
- 27% ▼ -21.00%
- Reading proficiency
- 45% ▼ -10.00%
- Median HH income
- $97,191
- Composite
- 35.62/100
- National rank
- #4889
- State rank
- #3 of 24 in MD
Livability — Gaithersburg
- Score
- 79/100
- State rank
- #59
- US rank
- #2228
Category grades
Schools grade is shown separately in the Schools card above.
Census & demographics
- County
- York County
- City population
- 129,925
- Metro
- York-Hanover, PA
- Population (ZIP)
- 18,570
- Household income
- $42,826
- Rent vs Own
- Severe rent burden
- 1360.0
Population outlook (Montgomery County) Hauer SSP2
- Today (2025)
- 1,173,231 people
- By 2030
- 1,237,402 · +5.5%
- By 2040
- 1,365,115 · +16.4%
- By 2050
- 1,491,592 · +27.1%
- By 2075
- 1,803,893 · +53.8%
- By 2100
- 2,035,619 · +73.5%
Race, ethnicity, and origin ACS 2023
- Neighborhood character
- Diverse neighborhood (Simpson 0.69)
- Race & ethnicity
- Hispanic / Latino 39% White 31% Black 24% Two or more races 15%
- Hispanic origin (detail)
- Mexican 5% Puerto Rican 22% Dominican 10%
- Common ancestry
- Romanian 2% Hispanic 1% Italian 1%
- Foreign-born
- 14% · Canada
- Languages at home
- 72% English-only · Spanish 25% French/Haitian/Cajun 2%
Political lean MEDSL · Montgomery
- 2024 margin
- Solid D (+53.3) · D 75.2% · R 21.9% · Other 2.9%
- 2008→2024 swing
- +8.7pp toward D · 2008: 44.6pp · 2024: 53.3pp
- All cycles
- 2024: D+53.3 2020: D+59.6 2016: D+55.5 2012: D+43.4 2008: D+44.6
Not yet ingested
- Civics
- —
Market trends
- HPI YoY
- ▼ -63.82%
- Current HPI
- 323.5537
- Rent YoY
- ▲ 6.37%
- Metro
- York-Hanover, PA
- State GDP YoY
- ▲ 2.97%
- F500 in state
- 12
Industry mix (Fortune 500 HQ in MD)
| Industry | F500 HQs | Revenue |
|---|---|---|
| Aerospace / Defense | 1 | $71B |
|
||
| Utilities | 1 | $25B |
|
||
| Hotels | 1 | $24B |
|
||
| Consumer Goods | 1 | $7B |
|
||
| Real Estate | 1 | $6B |
|
||
| Chemicals | 1 | $2B |
|
||
Price history
2 events — show timeline
- 2026-05-09 Pending — BRIGHT MLS
- 2026-05-04 Listed $600,000 BRIGHT MLS
Cash-flow waterfall
monthlySold comps — $/sqft
last 12 mo · ≤1 miLoading sold comps…