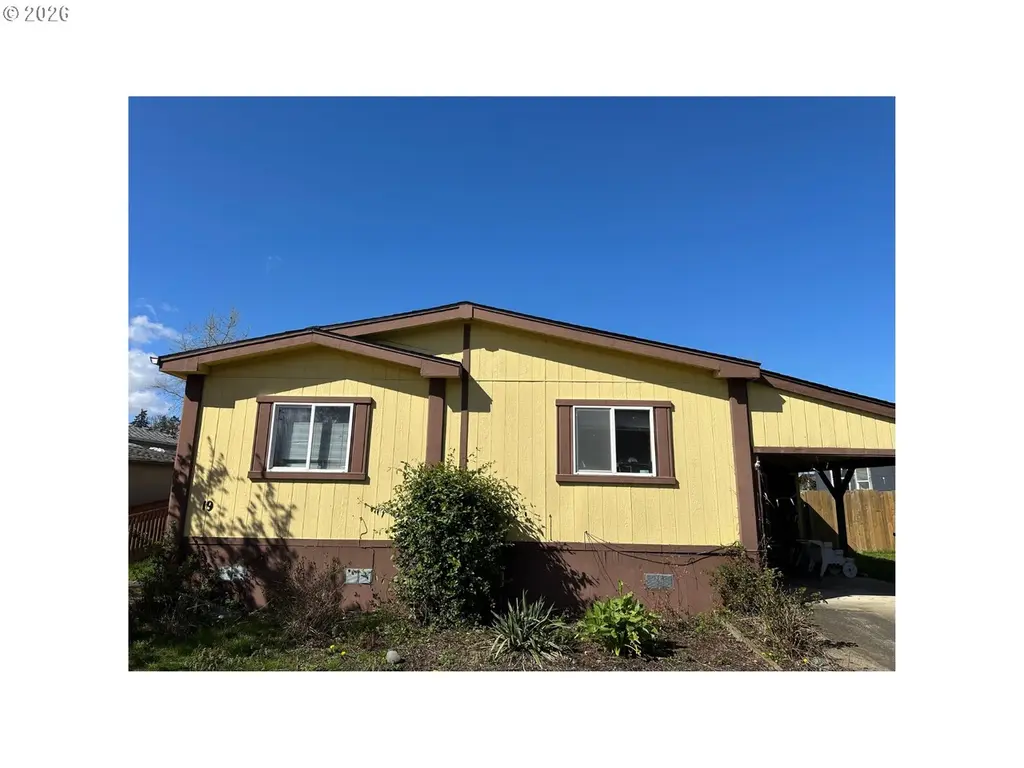
2519 NE 205th Ave
Fairview, OR 97024
$30,000D
3 bd · 2.0 ba ·
1,665 sqft ·
Built 1998
· Land
· Pending
· 7 DOM
Cashflow @ list (25.0% down · 7.5%)
Estimated rent
$2,212/mo
Mortgage (P&I)
−$157
Tax + insurance
−$50
HOA
−$1,000
Vac / Maint / Mgmt
−$465
Net cashflow
$540/mo
Annual
$6,485/yr
Cap rate
27.91%
Cash-on-cash
77.20%
DSCR
4.44
1% rule
7.37%
Cash to close
$8,400
Investor read
- This is a 3-bed/2.0-bath land listed at $30k.
- At list price, monthly cash flow is $540 ($6k/yr) — positive.
- The deal already cash-flows at list — no discount required.
- Meets the 1% rule at list price ($2k rent vs $30k).
- Only 7 days on market — expect competitive offers; lowballing is unlikely to land.
- Local home prices are declining (-3.0%/yr); year-one equity from $207 of loan paydown is wiped out by about $900 of value loss. Plan a longer hold.
- Location reads 75/100 on livability (#85 in OR, #4,103 nationally) — a middle-class / working-renter tenant base. Strengths: commute A+, housing A+, health & safety A-; Watch: cost of living D, amenities F.
- Reynolds SD 7 (suburban): math 21% / reading 36% proficiency, ranked #162 of 183 in OR (top 88%) — low school quality limits family demand, transient renter base, plan for 1-2y turnover; 66% free/reduced lunch — lower-income household profile, screen leases tightly.
- Zoned schools: Salish Ponds Elementary School (314 students, 99% FRL); Reynolds Middle School (837 students, 98% FRL); Reynolds High School (2,474 students, 67% FRL) — zoned schools average 88% FRL vs 66% district-wide (22 pts higher); higher-poverty schools than district average — tighter screening recommended.
- Watch-outs: HOA is 45% of rent.
- Market conditions: Rents soft (-1.0%/yr); 54 active listings in the ZIP; 14 comparable units currently listed for rent nearby; rentals at typical pace (median 24d on market — plan ~3-4 weeks tenant-placement turnaround); 2,041 units permitted in Multnomah County in 2024 (905 in 5+ unit buildings).
- Multnomah County population projected at +33% by 2050 — long-run rental-demand tailwind backs the buy-and-hold thesis.
- At projected returns (-3.0% appreciation + 0.0% rent growth), your $8k cash investment doubles in ~2 years — after that, you're playing with house money.
- Cap rate 27.9% vs local median 2.8% in Fairview — top-decile yield for the area; either an underpriced asset or a hidden risk that comps aren't pricing in. Stress-test before assuming the spread holds.
- This rent runs 38% of the median local income ($70k/yr) — at the standard rent-burdened threshold; future hikes will face affordability resistance.
Questions for listing agent
- What does the HOA fee cover, when was the last increase, and are there any pending special assessments or reserve-fund shortfalls?
- Is there a deadline driving the sale (1031 exchange, divorce, estate, relocation)? That informs how much negotiation room exists.
- Schools are F-rated, which usually means shorter tenancies and higher turnover. Who's the typical renter profile here, and what's been the actual vacancy rate?
- The area grade is low — what's the realistic commute time and amenity access for the typical tenant pool here? Any planned neighborhood developments (good or bad) we should know about?
- What's the average days-on-market for RENTAL listings here right now (not sales)? A rising rental-DOM trend means longer vacancies and softer asking-rent achievability than the comps imply.
- What's the recent tenant-quality profile in this submarket — average credit score on applications, eviction rate, late-payment / NSF rate, and stable-employment percentage? A property-management company in the area should have these aggregated.
- How much new for-sale + rental construction is in the pipeline within 1–3 miles? Heavy new supply typically softens prices + rents 12–24 months out; constrained supply supports both.
CashFlowRE · CFR-19QJJY0BCCZ16V
· Data 3 weeks ago
cashflowre.app · 2026-05-29