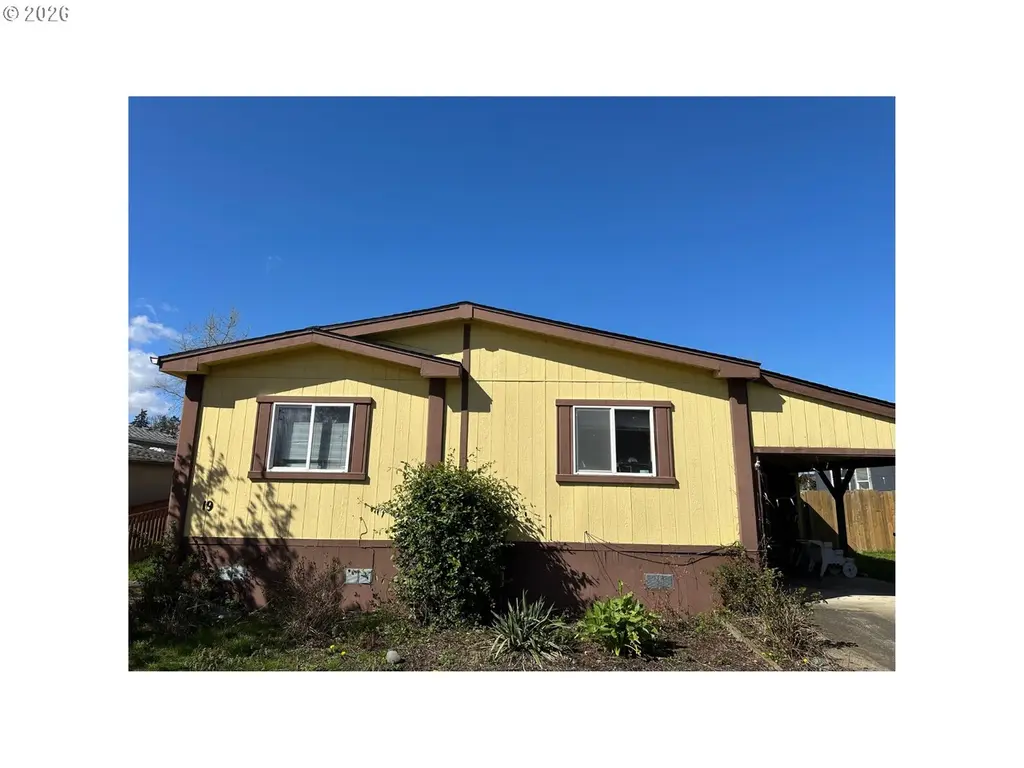
2519 NE 205th Ave · Fairview, OR
Flood risk 1/10 · Minimal
- FEMA flood zone
- X (unshaded)
- Chance of flooding over 30 yrs
- 0.0%
- Est. flood insurance / yr
- $507 – $1,088
Fire risk 1/10 · Minimal
- Est. fire insurance / yr
- $498 – $926
Heat risk 3/10 · Minor
- Hot days now (above 93°F)
- 7 days/yr
- Hot days in 30 yrs
- 15 days/yr
Wind risk 1/10 · Minimal
- Chance of severe wind over 30 yrs
- —
Air-quality risk 10/10 · Severe
- Unhealthy air days now
- 23 days/yr
- Unhealthy air days in 30 yrs
- 27 days/yr
Risk factors via First Street. Map © Google.
Why this score? — see what drove the D grade
The composite is a weighted blend of 9 inputs, each scored 0–100. Each bar is that input's sub-score; the figure is the points it added to the 100-point composite (weight × sub-score).
- Cash flow +15.0/30.0
- ARV discount +7.5/15.0
- 1% rule +5.0/10.0
- DSCR +5.0/10.0
- Livability +3.8/5.0
- Schools +2.7/10.0
- Condition / age +2.5/5.0
- Rent growth +2.3/5.0
- Appreciation +0.0/10.0
$30,000
🖨 Deal sheet (PDF) 📄 Offer letter ✓ Due diligence
Listing remarks
Great investment opportunity! Home is situated in a great community and is priced to sell. Home is situated in a convent location in central Fairview, a short drive to the I-84, wood Village, shopping and restaurants! Don't miss this opportunity!
Key facts
- Built 1998
- Listed 7 days
Neighborhood map
What this means for you Summary
Snapshot
- This is a 3-bed/2.0-bath land listed at $30k.
Deal economics
- At list price, monthly cash flow is $540 ($6k/yr) — positive.
- The deal already cash-flows at list — no discount required.
- Meets the 1% rule at list price ($2k rent vs $30k).
- Cap rate 27.9% vs local median 2.8% in Fairview — top-decile yield for the area; either an underpriced asset or a hidden risk that comps aren't pricing in. Stress-test before assuming the spread holds.
Location & tenants
- Location reads 75/100 on livability (#85 in OR, #4,103 nationally) — a middle-class / working-renter tenant base. Strengths: commute A+, housing A+, health & safety A-; Watch: cost of living D, amenities F.
- Reynolds SD 7 (suburban): math 21% / reading 36% proficiency, ranked #162 of 183 in OR (top 88%) — low school quality limits family demand, transient renter base, plan for 1-2y turnover; 66% free/reduced lunch — lower-income household profile, screen leases tightly.
- Zoned schools: Salish Ponds Elementary School (314 students, 99% FRL); Reynolds Middle School (837 students, 98% FRL); Reynolds High School (2,474 students, 67% FRL) — zoned schools average 88% FRL vs 66% district-wide (22 pts higher); higher-poverty schools than district average — tighter screening recommended.
- Market conditions: Rents soft (-1.0%/yr); 54 active listings in the ZIP; 14 comparable units currently listed for rent nearby; rentals at typical pace (median 24d on market — plan ~3-4 weeks tenant-placement turnaround); 2,041 units permitted in Multnomah County in 2024 (905 in 5+ unit buildings).
- This rent runs 38% of the median local income ($70k/yr) — at the standard rent-burdened threshold; future hikes will face affordability resistance.
Forward outlook
- Local home prices are declining (-3.0%/yr); year-one equity from $207 of loan paydown is wiped out by about $900 of value loss. Plan a longer hold.
- Multnomah County population projected at +33% by 2050 — long-run rental-demand tailwind backs the buy-and-hold thesis.
- At projected returns (-3.0% appreciation + 0.0% rent growth), your $8k cash investment doubles in ~2 years — after that, you're playing with house money.
Negotiation context
- Only 7 days on market — expect competitive offers; lowballing is unlikely to land.
Risks & watch-outs
- Watch-outs: HOA is 45% of rent.
Questions for the listing agent
- What does the HOA fee cover, when was the last increase, and are there any pending special assessments or reserve-fund shortfalls?
- Is there a deadline driving the sale (1031 exchange, divorce, estate, relocation)? That informs how much negotiation room exists.
- Schools are F-rated, which usually means shorter tenancies and higher turnover. Who's the typical renter profile here, and what's been the actual vacancy rate?
- The area grade is low — what's the realistic commute time and amenity access for the typical tenant pool here? Any planned neighborhood developments (good or bad) we should know about?
- What's the average days-on-market for RENTAL listings here right now (not sales)? A rising rental-DOM trend means longer vacancies and softer asking-rent achievability than the comps imply.
- What's the recent tenant-quality profile in this submarket — average credit score on applications, eviction rate, late-payment / NSF rate, and stable-employment percentage? A property-management company in the area should have these aggregated.
- How much new for-sale + rental construction is in the pipeline within 1–3 miles? Heavy new supply typically softens prices + rents 12–24 months out; constrained supply supports both.
Investment metrics
- 1% rule
- 7.37% ✓
- Cap rate
- 27.91%
- Cash-on-cash
- 77.20%
- DSCR
- 4.44
- GRM
- 1.1
CMA / ARV
No comps found within radius.
Projected returns pro-forma
-3.0% appreciation · 0.0% rent growth · sell at horizon
- IRR
- 69.7%
- Equity multiple
- 3.82×
- Total profit
- $23,723
- Equity at exit
- $4,473
- IRR
- 71.7%
- Equity multiple
- 6.07×
- Total profit
- $42,555
- Equity at exit
- $2,594
Cash invested: $8,400 (down + closing). Projections, not guarantees.
Landlord ↔ Tenant lean methodology
- Overall (STATE)
- 28 Tenant-Leaning
- State Oregon
- 28 Tenant-Leaning · D+6
- County
- — inherits STATE
- City
- — inherits STATE
ZIP-level market 97024
- Home prices YoY
- -20.3%
- Rents YoY
- -1.0%
- Active inventory
- 54
- Price-to-rent
- 1.1×
Monthly cashflow live
- Estimated rent
- $2,212 high interval (Pro) →
- Mortgage (P&I)
- −$157
- Tax est. 1.5%
- −$38 /mo · $450/yr
- Insurance
- −$12
- HOA
- −$1,000
- Vacancy / Maint / Mgmt
- −$465
- Net cashflow
- $540
Break-even live
Sensitivity live
| Price | -10% $561 | -5% $551 | +0% $540 | +5% $530 | +10% $520 |
|---|---|---|---|---|---|
| Rent | -10% $366 | -5% $453 | +0% $540 | +5% $628 | +10% $715 |
| Rate | -1.0pp $556 | -0.5pp $548 | base $540 | +0.5pp $533 | +1.0pp $525 |
UW: 25.0% down · 7.5% · 30yr · 1.5% tax · 5.0% vac · 8.0% maint · 8.0% mgmt
Financing live
Cash to close
- Down payment
- $7,500
- Closing costs
- $900
- Reserves months
- —
- Total cash needed
- —
Loan-product check · same deal, 3 products live
Conventional
25% down · 7.5% · 30yr
- Down + closing
- —
- Monthly P&I
- —
- Monthly cashflow
- —
- DSCR
- —
- Eligible?
- —
Personal DTI + credit; lowest rate.
DSCR
20% down · 8.5% · 30yr
- Down + closing
- —
- Monthly P&I
- —
- Monthly cashflow
- —
- DSCR
- —
- Eligible?
- —
No personal income docs; deal must DSCR.
Hard money
10% down · 12.0% · 12mo
- Down + closing
- —
- Monthly P&I
- —
- Monthly cashflow
- —
- DSCR
- —
- Eligible?
- —
Short-term bridge; refi at stabilization.
Rent comps 14 comps
| Address | Beds | Baths | Sqft | Rent | $/sqft | DOM | Units | Dist |
|---|---|---|---|---|---|---|---|---|
| 2667 NE 205th Ave Fairview, OR | 3.0 | 2.0 | 1115 | $1,950 | $1.75 | 25d | 1 | 0.19mi |
| 19927 NE Halsey St Unit 103 Portland, OR | 3.0 | 2.5 | 1225 | $1,895 | $1.55 | 45d | 1 | 0.48mi |
| 3794 NE Fairview Lake Way Fairview, OR | 3.0 | 2.0 | 1611 | $2,795 | $1.73 | 23d | 1 | 0.60mi |
| 21123 NE Osburn Loop Unit 21123 Fairview, OR | 3.0 | 2.5 | 1586 | $2,595 | $1.64 | 6d | 1 | 0.62mi |
| 609 Lincoln St Unit 609 Fairview, OR | 3.0 | 2.5 | 1100 | $2,250 | $2.05 | 45d | 1 | 0.75mi |
| 1497 NE Market Dr Fairview, OR | 2.0 | 2.0 | 1136 | $1,750 | $1.54 | 45d | 1 | 0.89mi |
| 21933 NE Chinook Way Fairview, OR | 1.0–3.0 | 1.0–2.5 | 874 | $2,315 | $2.65 | 3d | 8 | 0.90mi |
| 22100 NE Halsey St Fairview, OR | 1.0–3.0 | 1.0–2.0 | 1003 | $2,395 | $2.39 | 4d | 10 | 0.91mi |
| 22032 NE Chinook Way Unit B Fairview, OR | 2.0 | 2.5 | 1150 | $2,045 | $1.78 | 9d | 1 | 1.00mi |
| 22032 NE Chinook Way Apt A Fairview, OR | 2.0 | 2.5 | 1150 | $1,995 | $1.73 | 45d | 1 | 1.00mi |
| 22620 NE Hancock St Fairview, OR | 2.0 | 2.0 | 1196 | $1,995 | $1.67 | 23d | 1 | 1.14mi |
| 19316 NE Couch St Portland, OR | 3.0 | 2.0 | 1325 | $2,495 | $1.88 | 0d | 1 | 1.27mi |
| 20121 SE Stark St Portland, OR | 1.0–3.0 | 1.0–2.0 | 873 | $2,150 | $2.46 | 4d | 5 | 1.31mi |
| 18641 NE Everett Ct Portland, OR | 4.0 | 1.0 | 1450 | $2,500 | $1.72 | 18d | 1 | 1.38mi |
HOA detail
- Monthly dues
- $1,000 · $12,000/yr
Listing history 5 events
-
2026-04-02status Pending
-
2026-03-26$30,000 Active
-
1996-07-17soldstatus $250,000
-
1996-01-19soldstatus $20,000
-
1994-03-07soldstatus $120,000
ⓘ Source: listings_history table (triggers on properties + properties_extension) + one-shot
backfill from property_details.listing_events for pre-trigger history.
Climate risk First Street
- Flood 1/10 Low FEMA zone X (unshaded) · 0% chance over 30 yrs
- Wildfire 1/10 Low
- Heat 3/10 Moderate 7 d/yr ≥93°F today · 15 d/yr by 30 yrs out
- Wind 1/10 Low
- Air quality 10/10 Extreme 23 unhealthy d/yr today · 27 by 30 yrs out
Nearby sold comps map
Loading sold comps map…
Walkable amenities ~0.75 mi
Loading nearby amenities…
Taxation est. · year 1
- Rental income
- $26,548
- − Mortgage interest
- −$1,680
- − Property taxes
- −$450
- − Insurance
- −$150
- − Repairs & maintenance
- −$2,124
- − Management
- −$2,124
- − HOA
- −$12,000
- − Depreciation
- −$873
- Taxable income
- $7,147
- Est. tax owed @ 24.0%
- −$1,715
- After-tax cash flow
- $4,770/yr
For passive investors: Depreciation is non-cash, so a rental often shows a tax loss while cash-flowing — sheltering income. Rental losses are passive: they offset passive income freely, and up to $25,000/yr can offset ordinary (W-2) income if you actively participate and your MAGI is under $100k (phasing out to $0 by $150k); unused losses carry forward. On sale, claimed depreciation is recaptured at up to 25%, and gains may owe capital-gains tax (a 1031 exchange can defer both). Figures are a year-1 estimate at your 24.0% rate — not tax advice; consult a CPA.
Schools (NCES district)
- District
- Reynolds SD 7
- NCES district ID
- 4110520
- Math proficiency
- 21% ▬ 0.00%
- Reading proficiency
- 36% ▬ 0.00%
- Median HH income
- $45,502
- Composite
- 27.4/100
- National rank
- #12399
- State rank
- #162 of 183 in OR
Livability — Fairview
- Score
- 75/100
- State rank
- #85
- US rank
- #4103
Category grades
Schools grade is shown separately in the Schools card above.
Census & demographics
- Census place
- Fairview, OR
- County
- Multnomah County · 786,692 people
- City population
- 12,007
- Metro
- Portland-Vancouver-Hillsboro, OR-WA
- Population (ZIP)
- 12,007
- Household income
- $69,679
- Rent vs Own
- Severe rent burden
- 552.0
Population outlook (Multnomah County) Hauer SSP2
- Today (2025)
- 930,825 people
- By 2030
- 996,904 · +7.1%
- By 2040
- 1,121,379 · +20.5%
- By 2050
- 1,242,124 · +33.4%
- By 2075
- 1,464,431 · +57.3%
- By 2100
- 1,576,181 · +69.3%
Race, ethnicity, and origin ACS 2023
- Neighborhood character
- Diverse neighborhood (Simpson 0.68)
- Race & ethnicity
- White 48% Hispanic / Latino 27% Two or more races 15% Black 12% Pacific Islander 3% Native American 2% Asian 1%
- Hispanic origin (detail)
- Mexican 24%
- Common ancestry
- Portuguese 3% Italian 3% Lithuanian 3%
- Foreign-born
- 16% · Canada, Guatemala, Vietnam
- Languages at home
- 69% English-only · Spanish 23% Other Asian/Pacific 3% Russian/Polish/Slavic 1%
Political lean MEDSL · Multnomah
- 2024 margin
- Solid D (+62.1) · D 79.3% · R 17.2% · Other 3.5%
- 2008→2024 swing
- +6.0pp toward D · 2008: 56.1pp · 2024: 62.1pp
- All cycles
- 2024: D+62.1 2020: D+61.3 2016: D+58.3 2012: D+54.9 2008: D+56.1
Not yet ingested
- Civics
- —
Market trends
- HPI YoY
- ▼ -72.88%
- Current HPI
- 286.4915
- Rent YoY
- ▼ -0.99%
- Metro
- Portland-Vancouver-Hillsboro, OR-WA
- State GDP YoY
- ▲ 2.05%
- F500 in state
- 2
Industry mix (Fortune 500 HQ in OR)
| Industry | F500 HQs | Revenue |
|---|---|---|
| Consumer Goods | 1 | $51B |
|
||
Price history
-75.0% since first listed5 events — show timeline
- 2026-04-02 Pending — RMLS
- 2026-03-26 Listed $30,000 RMLS
- 1996-07-17 Sold (Public Records) $250,000 Public Records
- 1996-01-19 Sold (Public Records) $20,000 Public Records
- 1994-03-07 Sold (Public Records) $120,000 Public Records
Property tax history
+3.6%/yrLatest (2025): $17,886 · +5.9% YoY. Source: county tax records.
Cash-flow waterfall
monthlySold comps — $/sqft
last 12 mo · ≤1 miLoading sold comps…