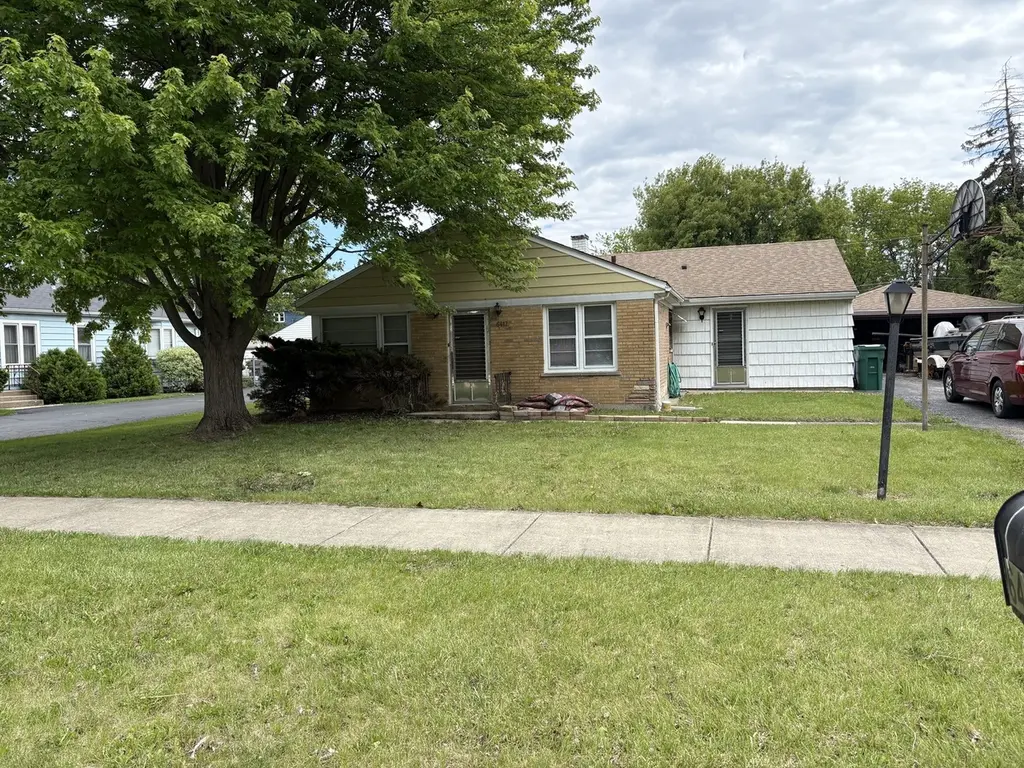
6417 W 85th Pl
Burbank, IL 60459
$295,900D+
3 bd · 1.0 ba ·
1,519 sqft ·
Built 1955
· SingleFamily
· Active
· 37 DOM
Cashflow @ list (25.0% down · 7.5%)
Estimated rent
$2,805/mo
Mortgage (P&I)
−$1,552
Tax + insurance
−$632
HOA
−$0
Vac / Maint / Mgmt
−$589
Net cashflow
$32/mo
Annual
$379/yr
Cap rate
6.42%
Cash-on-cash
0.46%
DSCR
1.02
1% rule
0.95%
Cash to close
$82,852
Investor read
- This is a 3-bed/1.0-bath single-family listed at $296k.
- At list price, monthly cash flow is $32 ($379/yr) — positive.
- The deal already cash-flows at list — no discount required.
- To meet the 1% rule (rent ≥ 1% of price), the offer needs to be $280k (5.2% below list).
- It's been on market 37 days — a 3% lower offer ($287k) is reasonable based on typical stale-listing flexibility.
- Recommended offer: $280k (5.2% below list) — sets the bar for 1% rule.
- Local home prices are declining (-3.0%/yr); year-one equity from $2k of loan paydown is wiped out by about $9k of value loss. Plan a longer hold.
- Location reads 78/100 on livability (#132 in IL, #2,422 nationally) — a middle-class / working-renter tenant base. Strengths: commute A+, housing A+, employment A-; Watch: health & safety C-, amenities F.
- Reavis Twp Hsd 220 (suburban): math 18% / reading 21% proficiency, ranked #420 of 620 in IL (top 68%) — low school quality limits family demand, transient renter base, plan for 1-2y turnover.
- Zoned schools: F B Mccord Elem School (math 22% / reading 17%, grade F, #1,054 of 2,056 statewide, top 54%, 254 students, 0% FRL); Liberty Junior High School (math 12% / reading 17%, grade F, #517 of 665 statewide, top 79%, 1,190 students, 0% FRL); Reavis High School (math 18% / reading 21%, grade F, #397 of 693 statewide, top 61%, 1,986 students, 0% FRL).
- Watch-outs: built in 1955 — expect roof / HVAC / electrical / plumbing capex.
- Market conditions: 55 active listings in the ZIP; 11 comparable units currently listed for rent nearby; rentals leasing fast (median 9d on market — plan ~1-2 weeks tenant-placement turnaround); 6,272 units permitted in Cook County in 2024 (4,658 in 5+ unit buildings).
- Cap rate 6.4% vs local median 5.3% in Burbank — meaningfully above typical; check what's discounted (condition, days-on-market, listing class) to confirm the premium yield is real.
Questions for listing agent
- It's been on market 37 days. Have you received any prior offers? Is the seller open to a 5% concession, seller financing, or rate buy-down credit?
- Built in 1955 — when were the roof, HVAC, electrical panel, plumbing, and water heater last replaced?
- Is there a deadline driving the sale (1031 exchange, divorce, estate, relocation)? That informs how much negotiation room exists.
- Schools are D-rated, which usually means shorter tenancies and higher turnover. Who's the typical renter profile here, and what's been the actual vacancy rate?
- The area grade is low — what's the realistic commute time and amenity access for the typical tenant pool here? Any planned neighborhood developments (good or bad) we should know about?
- What's the average days-on-market for RENTAL listings here right now (not sales)? A rising rental-DOM trend means longer vacancies and softer asking-rent achievability than the comps imply.
- What's the recent tenant-quality profile in this submarket — average credit score on applications, eviction rate, late-payment / NSF rate, and stable-employment percentage? A property-management company in the area should have these aggregated.
- How much new for-sale + rental construction is in the pipeline within 1–3 miles? Heavy new supply typically softens prices + rents 12–24 months out; constrained supply supports both.
CashFlowRE · CFR-1A4VFEDDBV5ZG7
· Data 16 h ago
cashflowre.app · 2026-05-29