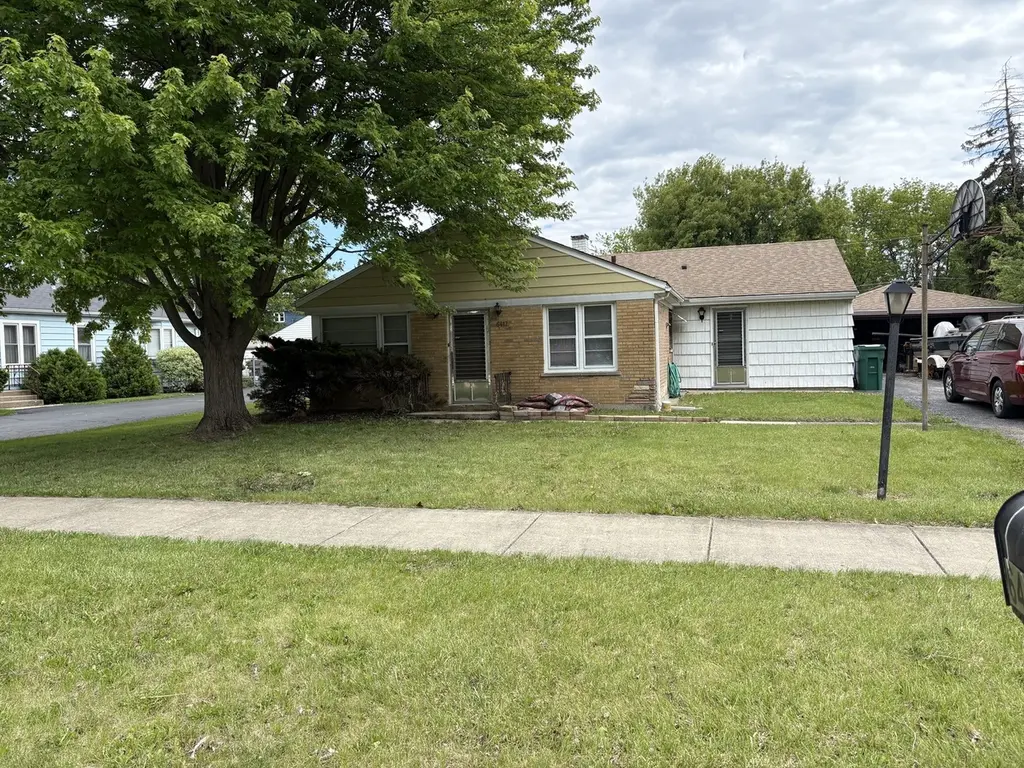
6417 W 85th Pl · Burbank, IL
Flood risk 4/10 · Minor
- FEMA flood zone
- X (unshaded)
- Chance of flooding over 30 yrs
- 0.22%
- Est. flood insurance / yr
- $473 – $860
Fire risk 1/10 · Minimal
- Est. fire insurance / yr
- $804 – $1,492
Heat risk 3/10 · Minor
- Hot days now (above 100°F)
- 7 days/yr
- Hot days in 30 yrs
- 15 days/yr
Wind risk 2/10 · Minimal
- Chance of severe wind over 30 yrs
- —
Air-quality risk 3/10 · Minor
- Unhealthy air days now
- 4 days/yr
- Unhealthy air days in 30 yrs
- 4 days/yr
Risk factors via First Street. Map © Google.
Why this score? — see what drove the D+ grade
The composite is a weighted blend of 9 inputs, each scored 0–100. Each bar is that input's sub-score; the figure is the points it added to the 100-point composite (weight × sub-score).
- ARV discount +15.0/15.0
- Cash flow +13.9/30.0
- 1% rule +4.5/10.0
- DSCR +4.2/10.0
- Livability +3.9/5.0
- Rent growth +2.5/5.0
- Condition / age +2.5/5.0
- Schools +1.8/10.0
- Appreciation +0.0/10.0
$295,900
🖨 Deal sheet (PDF) 📄 Offer letter ✓ Due diligence
Listing remarks
Welcome to this brick ranch in Burbank. This home features 3 bedrooms and 1.5 baths, a large kitchen with ample cabinet space, large family room with plenty of space for an office or den. This home boasts an oversized 2.5 car garage with a covered patio on the side leading to a generous backyard perfect for summer gatherings and entertainment. The yard provides plenty of space for pets, entertainment and more. This home also features a large driveway for plenty of parking and room for toys. Conveniently located near shopping and main roads. Schedule your showing today.
Key facts
- Large family room
- Large kitchen
- Covered patio
Tags
Neighborhood map
What this means for you Summary
Snapshot
- This is a 3-bed/1.0-bath single-family listed at $296k.
Deal economics
- At list price, monthly cash flow is $32 ($379/yr) — positive.
- The deal already cash-flows at list — no discount required.
- To meet the 1% rule (rent ≥ 1% of price), the offer needs to be $280k (5.2% below list).
- Recommended offer: $280k (5.2% below list) — sets the bar for 1% rule.
Location & tenants
- Location reads 78/100 on livability (#132 in IL, #2,422 nationally) — a middle-class / working-renter tenant base. Strengths: commute A+, housing A+, employment A-; Watch: health & safety C-, schools D-, amenities F.
- Reavis Twp Hsd 220 (suburban): math 18% / reading 21% proficiency, ranked #420 of 620 in IL (top 68%) — low school quality limits family demand, transient renter base, plan for 1-2y turnover.
- Market conditions: 51 active listings in the ZIP; 11 comparable units currently listed for rent nearby; rentals leasing fast (median 8d on market — plan ~1-2 weeks tenant-placement turnaround); 6,272 units permitted in Cook County in 2024 (4,658 in 5+ unit buildings).
Forward outlook
- Local home prices are declining (-3.0%/yr); year-one equity from $2k of loan paydown is wiped out by about $9k of value loss. Plan a longer hold.
Negotiation context
- It's been on market 34 days — a 3% lower offer ($287k) is reasonable based on typical stale-listing flexibility.
Risks & watch-outs
- Watch-outs: built in 1955 — expect roof / HVAC / electrical / plumbing capex.
Questions for the listing agent
- It's been on market 34 days. Have you received any prior offers? Is the seller open to a 5% concession, seller financing, or rate buy-down credit?
- Built in 1955 — when were the roof, HVAC, electrical panel, plumbing, and water heater last replaced?
- Is there a deadline driving the sale (1031 exchange, divorce, estate, relocation)? That informs how much negotiation room exists.
- Schools are D-rated, which usually means shorter tenancies and higher turnover. Who's the typical renter profile here, and what's been the actual vacancy rate?
- The area grade is low — what's the realistic commute time and amenity access for the typical tenant pool here? Any planned neighborhood developments (good or bad) we should know about?
- What's the average days-on-market for RENTAL listings here right now (not sales)? A rising rental-DOM trend means longer vacancies and softer asking-rent achievability than the comps imply.
- What's the recent tenant-quality profile in this submarket — average credit score on applications, eviction rate, late-payment / NSF rate, and stable-employment percentage? A property-management company in the area should have these aggregated.
- How much new for-sale + rental construction is in the pipeline within 1–3 miles? Heavy new supply typically softens prices + rents 12–24 months out; constrained supply supports both.
Investment metrics
- 1% rule
- 0.95% ✗
- Cap rate
- 6.42%
- Cash-on-cash
- 0.46%
- DSCR
- 1.02
- GRM
- 8.8
CMA / ARV
- ARV (on-the-fly)
- $358,484
- Comps found
- 12
Show comp detail 12 sales within ~0.75 mi
| Address | Dist | Beds/Ba | Sqft | Sold | Price | $/sf | Match |
|---|---|---|---|---|---|---|---|
| 6404 W 85th Pl | 0.05mi | 3/1.0 | 1,470 (-3%) | 3mo | $265,000 | $180 | 90 |
| 8432 Natchez Ave | 0.15mi | 3/2.0 | 1,536 (+1%) | 2mo | $442,500 | $288 | 86 |
| 6611 W 83rd St | 0.38mi | 3/1.0 | 1,500 (-1%) | 1mo | $289,900 | $193 | 80 |
| 6346 W 90th St | 0.53mi | 3/2.0 | 1,550 (+2%) | 1mo | $405,000 | $261 | 67 |
| 6308 W 84th Pl | 0.24mi | 4/2.0 (+1) | 1,400 (-8%) | 1mo | $300,000 | $214 | 66 |
| 8602 S Oak Park Ave | 0.45mi | 3/2.0 | 1,400 (-8%) | 2mo | $319,000 | $228 | 60 |
| 6201 W 90th Pl | 0.68mi | 4/2.0 (+1) | 1,451 (-4%) | 1mo | $316,500 | $218 | 51 |
| 9109 Crescent Ct | 0.70mi | 3/2.0 | 1,400 (-8%) | 1mo | $395,000 | $282 | 50 |
| 8632 New England Ave | 0.58mi | 3/2.0 | 1,690 (+11%) | 2mo | $399,000 | $236 | 49 |
| 8912 Windsor Ln | 0.71mi | 4/1.0 (+1) | 1,413 (-7%) | 3mo | $297,000 | $210 | 47 |
| 6743 W 89th Pl | 0.64mi | 3/2.0 | 1,325 (-13%) | 1mo | $359,000 | $271 | 44 |
| 9004 Meade Ave | 0.69mi | 3/2.5 | 1,340 (-12%) | 3mo | $360,000 | $269 | 40 |
Match score weights: distance 35% · size 25% · config 20% · recency 20%. Top-matched comps best support the ARV.
Projected returns pro-forma
-3.0% appreciation · 3.0% rent growth · sell at horizon
- IRR
- -15.5%
- Equity multiple
- 0.45×
- Total profit
- $-45,810
- Equity at exit
- $44,120
- IRR
- -7.0%
- Equity multiple
- 0.56×
- Total profit
- $-36,782
- Equity at exit
- $25,584
Cash invested: $82,852 (down + closing). Projections, not guarantees.
Landlord ↔ Tenant lean methodology
- Overall (STATE)
- 43 Moderately Tenant-Leaning
- State Illinois
- 43 Moderately Tenant-Leaning · D+7
- County
- — inherits STATE
- City
- — inherits STATE
ZIP-level market 60459
- Active inventory
- 51
- Price-to-rent
- 8.8×
Monthly cashflow live
- Estimated rent
- $2,805 high interval (Pro) →
- Mortgage (P&I)
- −$1,552
- Tax from tax record
- −$509 /mo · $6,108/yr
- Insurance
- −$123
- HOA
- −$0
- Vacancy / Maint / Mgmt
- −$589
- Net cashflow
- $32
Break-even live
Sensitivity live
| Price | -10% $199 | -5% $115 | +0% $32 | +5% $-52 | +10% $-136 |
|---|---|---|---|---|---|
| Rent | -10% $-190 | -5% $-79 | +0% $32 | +5% $142 | +10% $253 |
| Rate | -1.0pp $181 | -0.5pp $107 | base $32 | +0.5pp $-45 | +1.0pp $-123 |
UW: 25.0% down · 7.5% · 30yr · 1.5% tax · 5.0% vac · 8.0% maint · 8.0% mgmt
Financing live
Cash to close
- Down payment
- $73,975
- Closing costs
- $8,877
- Reserves months
- —
- Total cash needed
- —
Loan-product check · same deal, 3 products live
Conventional
25% down · 7.5% · 30yr
- Down + closing
- —
- Monthly P&I
- —
- Monthly cashflow
- —
- DSCR
- —
- Eligible?
- —
Personal DTI + credit; lowest rate.
DSCR
20% down · 8.5% · 30yr
- Down + closing
- —
- Monthly P&I
- —
- Monthly cashflow
- —
- DSCR
- —
- Eligible?
- —
No personal income docs; deal must DSCR.
Hard money
10% down · 12.0% · 12mo
- Down + closing
- —
- Monthly P&I
- —
- Monthly cashflow
- —
- DSCR
- —
- Eligible?
- —
Short-term bridge; refi at stabilization.
Rent comps 11 comps
| Address | Beds | Baths | Sqft | Rent | $/sqft | DOM | Units | Dist |
|---|---|---|---|---|---|---|---|---|
| 8621 Natchez Ave Burbank, IL | 3.0 | 3.0 | 2000 | $2,900 | $1.45 | 22d | 1 | 0.09mi |
| 6101 W 82nd Pl Burbank, IL | 3.0 | 2.0 | 1071 | $2,900 | $2.71 | 0d | 1 | 0.57mi |
| 8912 Windsor Ln Bridgeview, IL | 4.0 | 1.0 | 1413 | $2,800 | $1.98 | 11d | 1 | 0.71mi |
| 5834 W 89th Pl Oak Lawn, IL | 3.0 | 1.0 | 1100 | $2,150 | $1.95 | 22d | 1 | 0.82mi |
| 7847 Melvina Ave Burbank, IL | 3.0 | 1.0 | 1056 | $3,900 | $3.69 | 0d | 1 | 0.96mi |
| 6048 W 79th St Unit 3 Burbank, IL | 3.0 | 1.0 | 1200 | $2,100 | $1.75 | 6d | 1 | 0.99mi |
| 6101 W 94th St Unit A2 Oak Lawn, IL | 2.0 | 2.0 | 1100 | $1,900 | $1.73 | 6d | 1 | 1.11mi |
| 9308 Nordica Ave Oak Lawn, IL | 3.0 | 2.0 | 1349 | $960 | $0.71 | 13d | 1 | 1.21mi |
| 5217 W 87th St Unit 2 Oak Lawn, IL | 3.0 | 1.0 | 1200 | $1,800 | $1.50 | 8d | 1 | 1.45mi |
| 5212 Avery Pl Unit 1545958P Oak Lawn, IL | 3.0 | 1.0 | 2195 | $3,548 | $1.62 | 11d | 1 | 1.47mi |
| 9705 Oak Park Ave Oak Lawn, IL | 3.0 | 2.5 | 2050 | $4,975 | $2.43 | 0d | 1 | 1.48mi |
Listing history 16 events
-
2026-06-18days on market $295,900 Active 34 DOM
-
2026-06-17days on market $295,900 Active 33 DOM
-
2026-06-16days on market $295,900 Active 32 DOM
-
2026-06-15days on market $295,900 Active 31 DOM
-
2026-06-13days on market $295,900 Active 29 DOM
-
2026-06-13days on market $295,900 Active 28 DOM
-
2026-06-10price $295,900 Active 25 DOM
-
2026-06-09days on market $299,900 Active 25 DOM
-
2026-06-08days on market $299,900 Active 24 DOM
-
2026-06-07days on market $299,900 Active 23 DOM
-
2026-06-04days on market $299,900 Active 20 DOM
-
2026-06-03days on market $299,900 Active 19 DOM
-
2026-06-02days on market $299,900 Active 18 DOM
-
2026-06-01days on market $299,900 Active 17 DOM
-
2026-05-31days on market $299,900 Active 16 DOM
-
2026-05-15$299,900 Active
ⓘ Source: listings_history table (triggers on properties + properties_extension) + one-shot
backfill from property_details.listing_events for pre-trigger history.
Tax reassessment forecast IL · Partial reset (capped growth)
- Current annual tax
- $6,108 · $509/mo
- Projected year-2 tax
- $6,412 · $534/mo
- Expected delta
- +$305/yr (+$25/mo · 5.0%)
ⓘ Screening estimate from a state-policy table — verify with the county assessor before closing.
Climate risk First Street
- Flood 4/10 Moderate FEMA zone X (unshaded) · 22% chance over 30 yrs
- Wildfire 1/10 Low
- Heat 3/10 Moderate 7 d/yr ≥100°F today · 15 d/yr by 30 yrs out
- Wind 2/10 Low
- Air quality 3/10 Moderate 4 unhealthy d/yr today · 4 by 30 yrs out
Nearby sold comps map
Loading sold comps map…
Walkable amenities ~0.75 mi
Loading nearby amenities…
Taxation est. · year 1
- Rental income
- $33,654
- − Mortgage interest
- −$16,575
- − Property taxes
- −$6,108
- − Insurance
- −$1,480
- − Repairs & maintenance
- −$2,692
- − Management
- −$2,692
- − Depreciation
- −$8,608
- Taxable loss
- −$4,501
- Est. tax savings @ 24.0%
- +$1,080
- After-tax cash flow
- $1,459/yr
For passive investors: Depreciation is non-cash, so a rental often shows a tax loss while cash-flowing — sheltering income. Rental losses are passive: they offset passive income freely, and up to $25,000/yr can offset ordinary (W-2) income if you actively participate and your MAGI is under $100k (phasing out to $0 by $150k); unused losses carry forward. On sale, claimed depreciation is recaptured at up to 25%, and gains may owe capital-gains tax (a 1031 exchange can defer both). Figures are a year-1 estimate at your 24.0% rate — not tax advice; consult a CPA.
Schools (NCES district)
- District
- Reavis Twp Hsd 220
- NCES district ID
- 1733270
- Math proficiency
- 18% ▼ -3.00%
- Reading proficiency
- 21% ▼ -4.00%
- Median HH income
- $54,732
- Composite
- 17.94/100
- National rank
- #8994
- State rank
- #420 of 620 in IL
Livability — Burbank
- Score
- 78/100
- State rank
- #132
- US rank
- #2422
Category grades
Schools grade is shown separately in the Schools card above.
Census & demographics
- Census place
- Burbank, IL
- City population
- 28,822
- Population (ZIP)
- 28,822
Population outlook (Cook County) Hauer SSP2
- Today (2025)
- 5,347,519 people
- By 2030
- 5,357,703 · +0.2%
- By 2040
- 5,324,924 · -0.4%
- By 2050
- 5,230,762 · -2.2%
- By 2075
- 4,785,735 · -10.5%
- By 2100
- 4,188,836 · -21.7%
Race, ethnicity, and origin ACS 2023
- Neighborhood character
- Diverse neighborhood (Simpson 0.56)
- Race & ethnicity
- Hispanic / Latino 50% White 44% Two or more races 21% Asian 3% Black 1%
- Hispanic origin (detail)
- Mexican 45% Puerto Rican 2%
- Common ancestry
- Romanian 17% Armenian 1% Iranian 1%
- Foreign-born
- 32% · Canada, Jamaica, Vietnam
- Languages at home
- 40% English-only · Spanish 39% Russian/Polish/Slavic 12% Arabic 5%
Political lean MEDSL · Cook
- 2024 margin
- Solid D (+42.0) · D 70.4% · R 28.4% · Other 1.2%
- 2008→2024 swing
- -11.4pp toward R · 2008: 53.4pp · 2024: 42.0pp
- All cycles
- 2024: D+42.0 2020: D+50.3 2016: D+53.0 2012: D+49.4 2008: D+53.4
Not yet ingested
- Civics
- —
Market trends
- HPI YoY
- ▼ -188.56%
- Current HPI
- 223.2294
- Rent YoY
- —
- Metro
- —
- State GDP YoY
- ▲ 1.59%
- F500 in state
- 60
Industry mix (Fortune 500 HQ in IL)
| Industry | F500 HQs | Revenue |
|---|---|---|
| Insurance | 4 | $201B |
|
||
| Consumer Goods | 4 | $87B |
|
||
| Industrial Machinery | 3 | $64B |
|
||
| Healthcare | 2 | $55B |
|
||
| Retail / Pharmacy | 1 | $148B |
|
||
| Agriculture / Food | 1 | $86B |
|
||
Price history
1 event — show timeline
- 2026-05-15 Listed $299,900 MRED as Distributed by MLS Grid
Property tax history
+4.1%/yrLatest (2023): $6,108 · +7.9% YoY. Source: county tax records.
Cash-flow waterfall
monthlySold comps — $/sqft
last 12 mo · ≤1 miLoading sold comps…