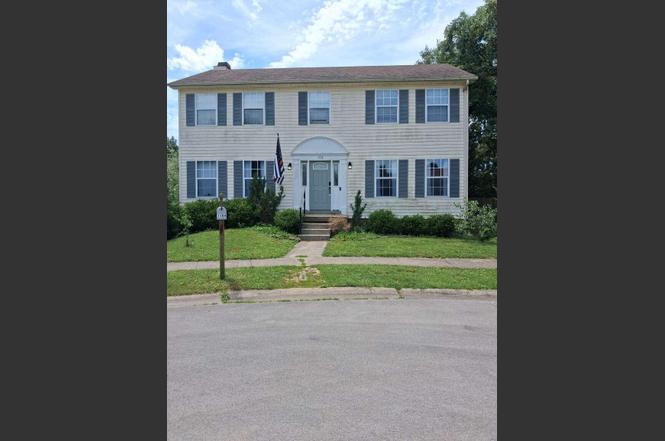
1104 Clovelly Ct
Lexington-Fayette, KY 40517
$299,000D
4 bd · 2.5 ba ·
2,276 sqft ·
Built 1993
· SingleFamily
· Active
· 8 DOM
Cashflow @ list (25.0% down · 7.5%)
Estimated rent
$2,102/mo
Mortgage (P&I)
−$1,568
Tax + insurance
−$296
HOA
−$0
Vac / Maint / Mgmt
−$441
Net cashflow
$-203/mo
Annual
$-2,440/yr
Cap rate
5.48%
Cash-on-cash
-2.91%
DSCR
0.87
1% rule
0.70%
Cash to close
$83,720
Investor read
- This is a 4-bed/2.5-bath single-family listed at $299k.
- At list price, monthly cash flow is $-203 ($-2k/yr) — negative.
- To cash-flow at today's rent, offer at most $263k (12.0% below list).
- To meet the 1% rule (rent ≥ 1% of price), the offer needs to be $210k (29.7% below list).
- Only 8 days on market — expect competitive offers; lowballing is unlikely to land.
- Recommended offer: $210k (29.7% below list) — sets the bar for 1% rule.
- Local home prices are declining (-3.0%/yr); year-one equity from $2k of loan paydown is wiped out by about $9k of value loss. Plan a longer hold.
- Location reads: area grade D — affects rentability + tenant quality, not the cash-flow math above.
- Fayette County (urban): math 35% / reading 45% proficiency, ranked #27 of 165 in KY (top 16%) — families likely to look elsewhere, expect single-tenant / working-renter base with shorter leases.
- Zoned schools: Millcreek Elementary School (math 19% / reading 24%, grade F, #556 of 676 statewide, top 83%, 541 students, 68% FRL); Tates Creek Middle School (math 29% / reading 38%, grade F, #105 of 217 statewide, top 51%, 769 students, 58% FRL); Tates Creek High School (math 29% / reading 32%, grade F, #121 of 254 statewide, top 47%, 1,734 students, 52% FRL).
- Market conditions: Rents rising fast (+4.5%/yr); 103 active listings in the ZIP; 7 comparable units currently listed for rent nearby; rentals at typical pace (median 24d on market — plan ~3-4 weeks tenant-placement turnaround); 1,036 units permitted in Fayette County in 2024 (542 in 5+ unit buildings).
- Fayette County population projected at +35% by 2050 — long-run rental-demand tailwind backs the buy-and-hold thesis.
- 3 sale attempts since 10y ago with the ask held roughly flat each time — persistent listings suggest the price (not the market) is what's stuck; bring a comps-based counter.
- Current owner paid $205k; 46% above their basis — modest negotiation headroom, anchor on the comps not their cost.
- Cap rate 5.5% vs local median 3.8% in Lexington-Fayette — top-decile yield for the area; either an underpriced asset or a hidden risk that comps aren't pricing in. Stress-test before assuming the spread holds.
- At $2,102/mo this rent would consume 47% of the median local household income ($54k/yr) (locally 2743% of renters already pay >50% of income on rent) — very limited rent-growth headroom before tenants either downsize or default.
Questions for listing agent
- What do current leases actually rent for vs. the listed asking? Can we see a recent rent roll and the last 12 months of T-12 income?
- Is there a deadline driving the sale (1031 exchange, divorce, estate, relocation)? That informs how much negotiation room exists.
- The area grade is low — what's the realistic commute time and amenity access for the typical tenant pool here? Any planned neighborhood developments (good or bad) we should know about?
- What's the average days-on-market for RENTAL listings here right now (not sales)? A rising rental-DOM trend means longer vacancies and softer asking-rent achievability than the comps imply.
- What's the recent tenant-quality profile in this submarket — average credit score on applications, eviction rate, late-payment / NSF rate, and stable-employment percentage? A property-management company in the area should have these aggregated.
- How much new for-sale + rental construction is in the pipeline within 1–3 miles? Heavy new supply typically softens prices + rents 12–24 months out; constrained supply supports both.
CashFlowRE · CFR-1AP7P55KB1JHKR
· Data 2 days ago
cashflowre.app · 2026-05-29