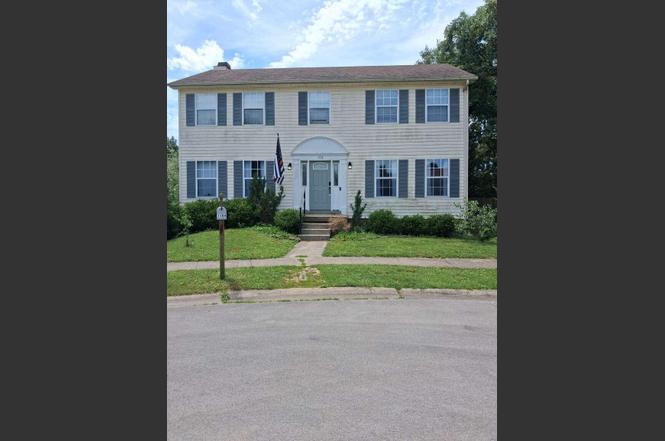
1104 Clovelly Ct · Lexington-Fayette, KY
Flood risk 1/10 · Minimal
- FEMA flood zone
- X (unshaded)
- Chance of flooding over 30 yrs
- 0.0%
- Est. flood insurance / yr
- $473 – $860
Fire risk 1/10 · Minimal
- Est. fire insurance / yr
- $839 – $1,559
Heat risk 4/10 · Minor
- Hot days now (above 101°F)
- 7 days/yr
- Hot days in 30 yrs
- 19 days/yr
Wind risk 2/10 · Minimal
- Chance of severe wind over 30 yrs
- 3.0%
Air-quality risk 1/10 · Minimal
- Unhealthy air days now
- 0 days/yr
- Unhealthy air days in 30 yrs
- 0 days/yr
Risk factors via First Street. Map © Google.
Why this score? — see what drove the D grade
The composite is a weighted blend of 9 inputs, each scored 0–100. Each bar is that input's sub-score; the figure is the points it added to the 100-point composite (weight × sub-score).
- ARV discount +15.0/15.0
- Cash flow +9.6/30.0
- Rent growth +3.6/5.0
- Schools +3.4/10.0
- DSCR +2.7/10.0
- Livability +2.5/5.0
- Condition / age +2.5/5.0
- 1% rule +2.0/10.0
- Appreciation +0.0/10.0
$299,000
🖨 Deal sheet 📄 Offer letter ✓ Due diligence
Listing remarks MLS
This spacious home with only had one owner and has recently had numerous updates including a new roof (September 2016) New Carpet (2016) lots of new paint (2016) along with several other updates including HVAC. Located on a quite cut-de-sac with a large back yard for outdoor activity. This home is located conveniently to the Fayette Mall, Tates Creek Centre, and easy access to new circle road. Sellers are family of the listing agent.
Key facts
- Workshop space
- Plenty of storage
- Backyard
Tags
Property features AI
Finance
- Other: Located in Park Place subdivision, Fayette County; Parcel number 20057720
Exterior
- Parking: Driveway; Has garage
- Utilities: Private sewer; No public utilities listed
- Home design: One-level property
- Construction: Wood siding; Shingle roof; Other foundation type; Built area approximately 3,952 total square feet
- Exterior features: Many trees on the lot; Private water source; Not on waterfront
Interior
- Bedrooms: 5 total rooms (bedroom count not specified separately)
- Flooring: Carpet; Hardwood; Laminate; Vinyl
- Bathrooms: 3 full bathrooms
- Heating & cooling: Hot water heating; Central air conditioning
- Interior features: Partially finished full basement with concrete foundation; Insulated windows with blinds, screens and window treatments
Neighborhood map
What this means for you Summary
Snapshot
- This is a 4-bed/2.5-bath single-family listed at $299k.
Deal economics
- At list price, monthly cash flow is $-203 ($-2k/yr) — negative.
- To cash-flow at today's rent, offer at most $263k (12.0% below list).
- To meet the 1% rule (rent ≥ 1% of price), the offer needs to be $210k (29.7% below list).
- Recommended offer: $210k (29.7% below list) — sets the bar for 1% rule.
- Cap rate 5.5% vs local median 3.8% in Lexington-Fayette — top-decile yield for the area; either an underpriced asset or a hidden risk that comps aren't pricing in. Stress-test before assuming the spread holds.
Location & tenants
- Location reads: area grade D — affects rentability + tenant quality, not the cash-flow math above.
- Fayette County (urban): math 35% / reading 45% proficiency, ranked #27 of 165 in KY (top 16%) — families likely to look elsewhere, expect single-tenant / working-renter base with shorter leases.
- Zoned schools: Millcreek Elementary School (math 19% / reading 24%, grade F, #556 of 676 statewide, top 83%, 541 students, 68% FRL); Tates Creek Middle School (math 29% / reading 38%, grade F, #105 of 217 statewide, top 51%, 769 students, 58% FRL); Tates Creek High School (math 29% / reading 32%, grade F, #121 of 254 statewide, top 47%, 1,734 students, 52% FRL).
- Market conditions: Rents rising fast (+4.5%/yr); 103 active listings in the ZIP; 7 comparable units currently listed for rent nearby; rentals at typical pace (median 24d on market — plan ~3-4 weeks tenant-placement turnaround); 1,036 units permitted in Fayette County in 2024 (542 in 5+ unit buildings).
- At $2,102/mo this rent would consume 47% of the median local household income ($54k/yr) (locally 2743% of renters already pay >50% of income on rent) — very limited rent-growth headroom before tenants either downsize or default.
Forward outlook
- Local home prices are declining (-3.0%/yr); year-one equity from $2k of loan paydown is wiped out by about $9k of value loss. Plan a longer hold.
- Fayette County population projected at +35% by 2050 — long-run rental-demand tailwind backs the buy-and-hold thesis.
Negotiation context
- Only 8 days on market — expect competitive offers; lowballing is unlikely to land.
- 3 sale attempts since 10y ago with the ask held roughly flat each time — persistent listings suggest the price (not the market) is what's stuck; bring a comps-based counter.
- Current owner paid $205k; 46% above their basis — modest negotiation headroom, anchor on the comps not their cost.
Questions for the listing agent
- What do current leases actually rent for vs. the listed asking? Can we see a recent rent roll and the last 12 months of T-12 income?
- Is there a deadline driving the sale (1031 exchange, divorce, estate, relocation)? That informs how much negotiation room exists.
- The area grade is low — what's the realistic commute time and amenity access for the typical tenant pool here? Any planned neighborhood developments (good or bad) we should know about?
- What's the average days-on-market for RENTAL listings here right now (not sales)? A rising rental-DOM trend means longer vacancies and softer asking-rent achievability than the comps imply.
- What's the recent tenant-quality profile in this submarket — average credit score on applications, eviction rate, late-payment / NSF rate, and stable-employment percentage? A property-management company in the area should have these aggregated.
- How much new for-sale + rental construction is in the pipeline within 1–3 miles? Heavy new supply typically softens prices + rents 12–24 months out; constrained supply supports both.
Investment metrics
- 1% rule
- 0.70% ✗
- Cap rate
- 5.48%
- Cash-on-cash
- -2.91%
- DSCR
- 0.87
- GRM
- 11.9
CMA / ARV
- ARV (on-the-fly)
- $393,748
- Comps found
- 12
Show comp detail 12 sales within ~0.75 mi
| Address | Dist | Beds/Ba | Sqft | Sold | Price | $/sf | Match |
|---|---|---|---|---|---|---|---|
| 1161 Narrow Ln | 0.13mi | 4/2.5 | 2,156 (-5%) | 12mo | $385,500 | $179 | 75 |
| 1050 Trent Blvd | 0.36mi | 3/2.0 (-1) | 2,200 (-3%) | 11mo | $204,000 | $93 | 62 |
| 4517 Pentlalla Pt | 0.54mi | 4/2.5 | 2,220 (-2%) | 13mo | $395,000 | $178 | 60 |
| 1101 Tanbark Rd | 0.31mi | 4/3.0 | 2,512 (+10%) | 13mo | $440,000 | $175 | 55 |
| 1204 Rockbridge Rd | 0.54mi | 3/2.5 (-1) | 2,100 (-8%) | 3mo | $345,000 | $164 | 54 |
| 1131 Tatesbrook Dr | 0.32mi | 4/2.0 | 1,975 (-13%) | 13mo | $290,000 | $147 | 50 |
| 4297 Saron Dr | 0.66mi | 4/2.5 | 2,519 (+11%) | 2mo | $434,900 | $173 | 50 |
| 4725 Spring Creek Dr | 0.71mi | 3/2.5 (-1) | 2,181 (-4%) | 11mo | $392,000 | $180 | 46 |
| 4712 Hartland Pkwy | 0.72mi | 3/3.0 (-1) | 2,375 (+4%) | 8mo | $355,000 | $149 | 46 |
| 4621 Fieldmoor Dr | 0.61mi | 4/2.5 | 2,011 (-12%) | 8mo | $337,500 | $168 | 45 |
| 3669 Niles Ct | 0.42mi | 3/2.0 (-1) | 1,950 (-14%) | 14mo | $279,000 | $143 | 38 |
| 4608 Hickory Creek Dr | 0.62mi | 3/2.0 (-1) | 1,956 (-14%) | 13mo | $415,000 | $212 | 29 |
Match score weights: distance 35% · size 25% · config 20% · recency 20%. Top-matched comps best support the ARV.
Projected returns pro-forma
-3.0% appreciation · 4.52% rent growth · sell at horizon
- IRR
- -19.7%
- Equity multiple
- 0.30×
- Total profit
- $-58,231
- Equity at exit
- $44,582
- IRR
- -10.0%
- Equity multiple
- 0.36×
- Total profit
- $-53,948
- Equity at exit
- $25,852
Cash invested: $83,720 (down + closing). Projections, not guarantees.
Landlord ↔ Tenant lean methodology
- Overall (STATE)
- 83 Strongly Landlord-Friendly
- State Kentucky
- 83 Strongly Landlord-Friendly · R+16
- County
- — inherits STATE
- City
- — inherits STATE
ZIP-level market 40517
- Rents YoY
- 4.5%
- Active inventory
- 103
- Price-to-rent
- 11.9×
Monthly cashflow live
- Estimated rent
- $2,102 high interval (Pro) →
- Mortgage (P&I)
- −$1,568
- Tax from tax record
- −$171 /mo · $2,053/yr
- Insurance
- −$125
- HOA
- −$0
- Vacancy / Maint / Mgmt
- −$441
- Net cashflow
- $-203
Break-even live
UW: 25.0% down · 7.5% · 30yr · 1.5% tax · 5.0% vac · 8.0% maint · 8.0% mgmt
Financing live
Cash to close
- Down payment
- $74,750
- Closing costs
- $8,970
- Reserves months
- —
- Total cash needed
- —
Loan-product check · same deal, 3 products live
Conventional
25% down · 7.5% · 30yr
- Down + closing
- —
- Monthly P&I
- —
- Monthly cashflow
- —
- DSCR
- —
- Eligible?
- —
Personal DTI + credit; lowest rate.
DSCR
20% down · 8.5% · 30yr
- Down + closing
- —
- Monthly P&I
- —
- Monthly cashflow
- —
- DSCR
- —
- Eligible?
- —
No personal income docs; deal must DSCR.
Hard money
10% down · 12.0% · 12mo
- Down + closing
- —
- Monthly P&I
- —
- Monthly cashflow
- —
- DSCR
- —
- Eligible?
- —
Short-term bridge; refi at stabilization.
Rent comps 7 comps
| Address | Beds | Baths | Sqft | Rent | $/sqft | DOM | Units | Dist |
|---|---|---|---|---|---|---|---|---|
| 1077 Duval St #102 Lexington, KY | 3.0 | 3.0 | 1600 | $1,800 | $1.12 | 14d | 1 | 0.53mi |
| 1340 Ox Hill Dr Lexington, KY | 4.0 | 2.0 | 2042 | $1,695 | $0.83 | 23d | 1 | 0.54mi |
| 3732 Old Tates Creek Pike Lexington, KY | 3.0 | 2.5 | 1764 | $2,050 | $1.16 | 23d | 1 | 0.77mi |
| 4616 Landing Dr Lexington, KY | 4.0 | 2.5 | 1802 | $2,300 | $1.28 | 23d | 1 | 0.80mi |
| 736 Lori Ln Lexington, KY | 3.0 | 2.5 | 2400 | $2,600 | $1.08 | 23d | 1 | 0.83mi |
| 3593 Harper Woods Ln Lexington, KY | 4.0 | 2.5 | 3100 | $3,195 | $1.03 | 23d | 1 | 1.28mi |
| 813 Vermillion Peak Pass Lexington, KY | 4.0 | 2.5 | 1950 | $2,200 | $1.13 | 14d | 1 | 1.36mi |
Listing history 7 events
-
2026-06-18days on market $299,000 Active 8 DOM
-
2026-06-17days on market $299,000 Active 7 DOM
-
2026-06-16days on market $299,000 Active 6 DOM
-
2026-06-15days on market $299,000 Active 5 DOM
-
2026-06-14days on market $299,000 Active 3 DOM
-
2026-06-13remarks 553-char remark
-
2026-06-13$299,000 Active 2 DOM
ⓘ Source: listings_history table (triggers on properties + properties_extension) + one-shot
backfill from property_details.listing_events for pre-trigger history.
Tax reassessment forecast KY · Resets to sale price
- Current annual tax
- $2,053 · $171/mo
- Projected year-2 tax
- $2,571 · $214/mo
- Expected delta
- +$519/yr (+$43/mo · 25.3%)
ⓘ Screening estimate from a state-policy table — verify with the county assessor before closing.
Climate risk First Street
- Flood 1/10 Low FEMA zone X (unshaded) · 0% chance over 30 yrs
- Wildfire 1/10 Low
- Heat 4/10 Moderate 7 d/yr ≥101°F today · 19 d/yr by 30 yrs out
- Wind 2/10 Low 3% chance of damaging wind over 30 yrs
- Air quality 1/10 Low 0 unhealthy d/yr today · 0 by 30 yrs out
Nearby sold comps map
Loading sold comps map…
Walkable amenities ~0.75 mi
Loading nearby amenities…
Taxation est. · year 1
- Rental income
- $25,220
- − Mortgage interest
- −$16,749
- − Property taxes
- −$2,053
- − Insurance
- −$1,495
- − Repairs & maintenance
- −$2,018
- − Management
- −$2,018
- − Depreciation
- −$8,698
- Taxable loss
- −$7,810
- Est. tax savings @ 24.0%
- +$1,874
- After-tax cash flow
- $-566/yr
For passive investors: Depreciation is non-cash, so a rental often shows a tax loss while cash-flowing — sheltering income. Rental losses are passive: they offset passive income freely, and up to $25,000/yr can offset ordinary (W-2) income if you actively participate and your MAGI is under $100k (phasing out to $0 by $150k); unused losses carry forward. On sale, claimed depreciation is recaptured at up to 25%, and gains may owe capital-gains tax (a 1031 exchange can defer both). Figures are a year-1 estimate at your 24.0% rate — not tax advice; consult a CPA.
Schools (NCES district)
- District
- Fayette County
- NCES district ID
- 2101860
- Math proficiency
- 35% ▼ -16.00%
- Reading proficiency
- 45% ▼ -13.00%
- Median HH income
- $49,245
- Composite
- 34.38/100
- National rank
- #5211
- State rank
- #27 of 165 in KY
Livability — Lexington-Fayette
No livability data for this city. (Only ~50 U.S. cities are tracked.)
Census & demographics
- Census place
- Lexington-Fayette, KY
- County
- Fayette County · 317,143 people
- City population
- 321,882
- Metro
- Lexington-Fayette, KY
- Population (ZIP)
- 35,656
- Household income
- $53,670
- Rent vs Own
- Severe rent burden
- 2743.0
Population outlook (Fayette County) Hauer SSP2
- Today (2025)
- 363,454 people
- By 2030
- 388,270 · +6.8%
- By 2040
- 438,688 · +20.7%
- By 2050
- 490,667 · +35.0%
- By 2075
- 625,394 · +72.1%
- By 2100
- 721,354 · +98.5%
Race, ethnicity, and origin ACS 2023
- Neighborhood character
- Diverse neighborhood (Simpson 0.57)
- Race & ethnicity
- White 60% Black 24% Two or more races 9% Hispanic / Latino 8% Asian 2%
- Hispanic origin (detail)
- Mexican 5%
- Common ancestry
- Italian 3% Lithuanian 2% Slovak 1%
- Foreign-born
- 9% · Canada
- Languages at home
- 87% English-only · Spanish 6% Other Indo-European 2% Arabic 1%
Political lean MEDSL · Fayette
- 2024 margin
- D (+18.1) · D 58.0% · R 39.9% · Other 2.1%
- 2008→2024 swing
- +13.3pp toward D · 2008: 4.8pp · 2024: 18.1pp
- All cycles
- 2024: D+18.1 2020: D+20.8 2016: D+9.5 2012: D+1.0 2008: D+4.8
Not yet ingested
- Civics
- —
Market trends
- HPI YoY
- ▼ -182.53%
- Current HPI
- 248.0466
- Rent YoY
- ▲ 4.52%
- Metro
- Lexington-Fayette, KY
- State GDP YoY
- ▲ 1.81%
- F500 in state
- 4
Industry mix (Fortune 500 HQ in KY)
| Industry | F500 HQs | Revenue |
|---|---|---|
| Healthcare | 1 | $118B |
|
||
| Food / Beverage | 1 | $7B |
|
||
Price history
+45.1% since first listed8 events — show timeline
- 2026-06-10 Listed $299,000 ImagineMLS
- 2017-03-27 Sold (Public Records) $204,900 Public Records
- 2017-03-24 Sold (MLS) $204,900 ImagineMLS
- 2017-02-05 Pending — ImagineMLS
- 2016-10-24 Listed $206,500 ImagineMLS
- 2016-10-24 Listing Removed — ImagineMLS
- 2016-09-27 Price Changed $206,500 ImagineMLS
- 2016-09-27 Listed $206,000 ImagineMLS
Property tax history
+1.8%/yrLatest (2015): $2,053 · +1.8% YoY. Source: county tax records.
Cash-flow waterfall
monthlySold comps — $/sqft
last 12 mo · ≤1 miLoading sold comps…