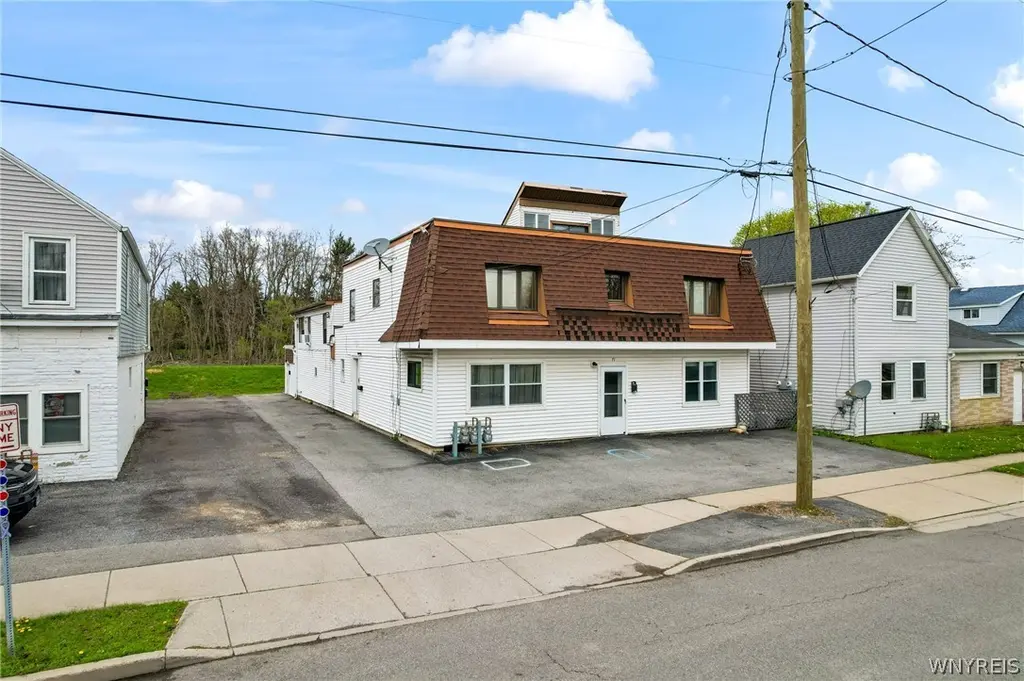
71 Saint John St
Lancaster, NY 14086
$349,900B+
6 bd · 3.0 ba ·
5,157 sqft ·
Built 1940
· MultiFamily
· Pending
· 9 DOM
Cashflow @ list (25.0% down · 7.5%)
Estimated rent
$5,134/mo
Mortgage (P&I)
−$1,835
Tax + insurance
−$901
HOA
−$0
Vac / Maint / Mgmt
−$1,078
Net cashflow
$1,320/mo
Annual
$15,836/yr
Cap rate
10.82%
Cash-on-cash
16.16%
DSCR
1.72
1% rule
1.47%
Cash to close
$97,972
Investor read
- This is a 3 × 3-bed/1.0-bath units multifamily listed at $350k.
- At list price, monthly cash flow is $1k ($16k/yr) — positive. Per door: $440/mo.
- The deal already cash-flows at list — no discount required.
- Meets the 1% rule at list price ($5k rent vs $350k).
- Only 9 days on market — expect competitive offers; lowballing is unlikely to land.
- Local home prices are declining (-3.0%/yr); year-one equity from $2k of loan paydown is wiped out by about $10k of value loss. Plan a longer hold.
- Location reads 78/100 on livability (#164 in NY, #2,566 nationally) — a middle-class / working-renter tenant base. Strengths: crime A+, housing A+, health & safety A+; Watch: amenities F, commute F.
- Lancaster Central School District (suburban): math 57% / reading 61% proficiency, ranked #234 of 590 in NY (top 40%) — acceptable for families but not a draw, mixed tenant base, ~2y average lease; only 14% free/reduced lunch — higher-income household profile.
- Watch-outs: property tax is 2.6% of price; built in 1940 — expect roof / HVAC / electrical / plumbing capex.
- Market conditions: 152 active listings in the ZIP; solid renter incomes; 1,244 units permitted in Erie County in 2024 (563 in 5+ unit buildings).
- 2 sale attempts since 7y ago with the ask held roughly flat each time — persistent listings suggest the price (not the market) is what's stuck; bring a comps-based counter.
- At projected returns (-3.0% appreciation + 3.0% rent growth), your $98k cash investment doubles in ~8 years — after that, you're playing with house money.
- Climate carrying-cost: moderate flood risk — expect insurance premiums to compound above CPI over the hold.
- Cap rate 10.8% vs local median 2.9% in Lancaster — top-decile yield for the area; either an underpriced asset or a hidden risk that comps aren't pricing in. Stress-test before assuming the spread holds.
- At $5,134/mo this rent would consume 62% of the median local household income ($99k/yr) (locally 513% of renters already pay >50% of income on rent) — very limited rent-growth headroom before tenants either downsize or default.
Questions for listing agent
- Can we see the unit-by-unit rent roll, current vacancy, and any below-market leases? What's the average tenancy length?
- What capital expenditures (roof, boiler, parking lot, exteriors) have been made in the last 5 years, and what's planned in the next 2?
- Built in 1940 — when were the roof, HVAC, electrical panel, plumbing, and water heater last replaced?
- Property tax is high relative to price — has the assessment been appealed recently, and will the sale trigger a re-assessment?
- Is there a deadline driving the sale (1031 exchange, divorce, estate, relocation)? That informs how much negotiation room exists.
- Schools are A-rated — typically a magnet for longer-tenancy family renters. What's the average tenant stay here, and is there a school-zone premium baked into asking?
- What's the average days-on-market for RENTAL listings here right now (not sales)? A rising rental-DOM trend means longer vacancies and softer asking-rent achievability than the comps imply.
- What's the recent tenant-quality profile in this submarket — average credit score on applications, eviction rate, late-payment / NSF rate, and stable-employment percentage? A property-management company in the area should have these aggregated.
CashFlowRE · CFR-1AZJS3854549VF
· Data 3 weeks ago
cashflowre.app · 2026-05-29