 🏷️ Likely Rental
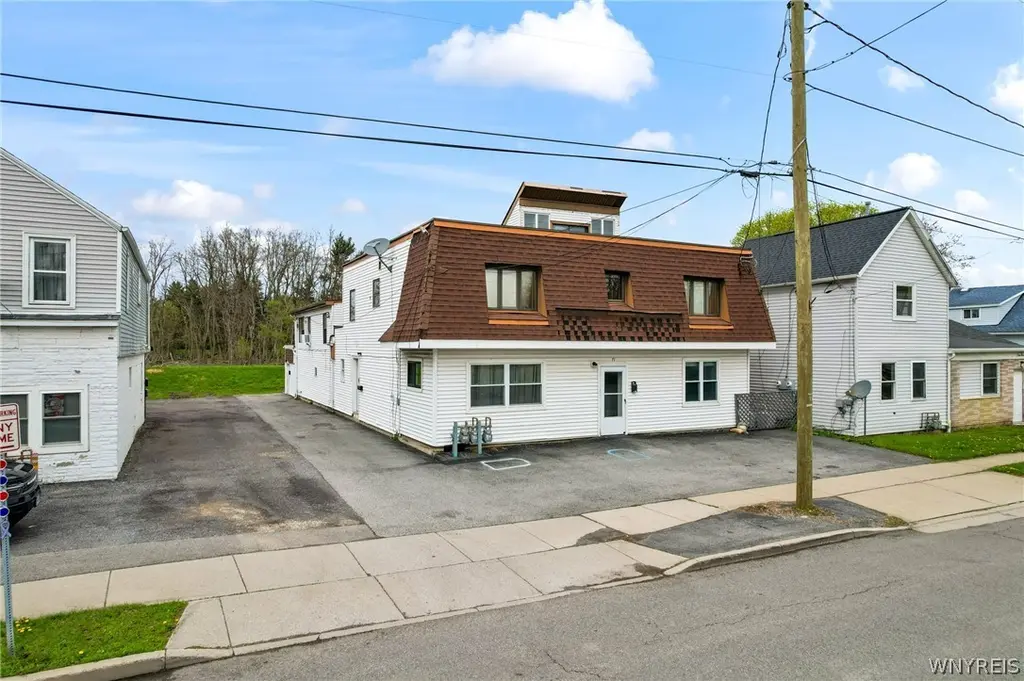
71 Saint John St · Lancaster, NY
Flood risk 5/10 · Moderate
- FEMA flood zone
- X (unshaded)
- Chance of flooding over 30 yrs
- 0.24%
- Est. flood insurance / yr
- $473 – $860
Fire risk 2/10 · Minimal
- Est. fire insurance / yr
- $691 – $1,283
Heat risk 2/10 · Minimal
- Hot days now (above 92°F)
- 7 days/yr
- Hot days in 30 yrs
- 15 days/yr
Wind risk 1/10 · Minimal
- Chance of severe wind over 30 yrs
- —
Air-quality risk 3/10 · Minor
- Unhealthy air days now
- 2 days/yr
- Unhealthy air days in 30 yrs
- 3 days/yr
Risk factors via First Street. Map © Google.
Why this score? — see what drove the B+ grade
The composite is a weighted blend of 9 inputs, each scored 0–100. Each bar is that input's sub-score; the figure is the points it added to the 100-point composite (weight × sub-score).
- Cash flow +30.0/30.0
- ARV discount +15.0/15.0
- DSCR +10.0/10.0
- 1% rule +9.7/10.0
- Schools +5.2/10.0
- Livability +3.9/5.0
- Rent growth +2.5/5.0
- Condition / age +2.5/5.0
- Appreciation +0.0/10.0
$349,900
🖨 Deal sheet 📄 Offer letter ✓ Due diligence
Multi-family units
County records classify this as Multi-Family (2-4 Unit). Listing-text estimate: 3 units. confirmed
Listing remarks
Exceptional investment or owner-occupant opportunity in the highly sought-after Village of Lancaster! This spacious 3-unit property offers over 5,000 sq ft of living space, strong income potential, and even room to expand with the possibility of a 4th unit. Unit 1 has been fully remodeled from top to bottom and features a modern, open-concept layout with 3 bedrooms and 1 full bath. Updates include a completely renovated kitchen and bathroom, new flooring, updated windows, and fully updated plumbing and electrical-truly turnkey. The boiler and hot water tank for Unit 1 were replaced in 2010. This unit is vacant and ready for an owner-occupant or new tenant. Unit 2 offers 4 bedrooms and 1 ful
Key facts
- 3 unit property
- Fully remodeled
- Renovated bathroom
Tags
Property features AI
Finance
- Financial info: Owner pays water; water included in rent; Operating expenses include insurance, maintenance (structure and general), and water/sewer
Exterior
- Parking: Paved parking with two or more spaces; Detached garage providing 1 garage space
- Utilities: Electricity connected; Water connected (public); Sewer connected
- Home design: Multi-family property with 3 total units; 2 stories
- Construction: Block, concrete and vinyl siding construction; Asphalt and flat roof; Poured foundation; Existing (resale) property
- Exterior features: Rectangular residential lot; Near public transit; City street frontage
Interior
- Kitchen: Eat-in kitchens in some units; Oven/range; Dishwasher (in select units); Refrigerator (in select units); Microwave (in one unit)
- Bedrooms: Unit mix includes 1-bed, 3-bed and 4-bed units (bedroom counts listed per unit)
- Flooring: Carpet; Hardwood; Luxury vinyl; Tile; Varies by unit
- Bathrooms: Three full bathrooms total (full baths listed per unit)
- Heating & cooling: Gas heating; Baseboard heat; Wall furnaces
- Interior features: Accessible bedroom; Bedroom on main level; Full walk-out basement with sump pump
- Laundry & utility: Laundry in unit for some units; Washer hookup available; Washer and dryer present in at least one unit; Gas water heater
Neighborhood map
What this means for you Summary
Snapshot
- This is a 3 × 3-bed/1.0-bath units multifamily listed at $350k.
Deal economics
- At list price, monthly cash flow is $1k ($16k/yr) — positive. Per door: $440/mo.
- The deal already cash-flows at list — no discount required.
- Meets the 1% rule at list price ($5k rent vs $350k).
- Cap rate 10.8% vs local median 2.9% in Lancaster — top-decile yield for the area; either an underpriced asset or a hidden risk that comps aren't pricing in. Stress-test before assuming the spread holds.
Location & tenants
- Location reads 78/100 on livability (#164 in NY, #2,566 nationally) — a middle-class / working-renter tenant base. Strengths: crime A+, housing A+, health & safety A+; Watch: amenities F, commute F.
- Lancaster Central School District (suburban): math 57% / reading 61% proficiency, ranked #234 of 590 in NY (top 40%) — acceptable for families but not a draw, mixed tenant base, ~2y average lease; only 14% free/reduced lunch — higher-income household profile.
- Market conditions: 152 active listings in the ZIP; solid renter incomes; 1,244 units permitted in Erie County in 2024 (563 in 5+ unit buildings).
- At $5,134/mo this rent would consume 62% of the median local household income ($99k/yr) (locally 513% of renters already pay >50% of income on rent) — very limited rent-growth headroom before tenants either downsize or default.
Forward outlook
- Local home prices are declining (-3.0%/yr); year-one equity from $2k of loan paydown is wiped out by about $10k of value loss. Plan a longer hold.
- At projected returns (-3.0% appreciation + 3.0% rent growth), your $98k cash investment doubles in ~8 years — after that, you're playing with house money.
Negotiation context
- Only 9 days on market — expect competitive offers; lowballing is unlikely to land.
- 2 sale attempts since 7y ago with the ask held roughly flat each time — persistent listings suggest the price (not the market) is what's stuck; bring a comps-based counter.
Risks & watch-outs
- Watch-outs: property tax is 2.6% of price; built in 1940 — expect roof / HVAC / electrical / plumbing capex.
- Climate carrying-cost: moderate flood risk — expect insurance premiums to compound above CPI over the hold.
Questions for the listing agent
- Can we see the unit-by-unit rent roll, current vacancy, and any below-market leases? What's the average tenancy length?
- What capital expenditures (roof, boiler, parking lot, exteriors) have been made in the last 5 years, and what's planned in the next 2?
- Built in 1940 — when were the roof, HVAC, electrical panel, plumbing, and water heater last replaced?
- Property tax is high relative to price — has the assessment been appealed recently, and will the sale trigger a re-assessment?
- Is there a deadline driving the sale (1031 exchange, divorce, estate, relocation)? That informs how much negotiation room exists.
- Schools are A-rated — typically a magnet for longer-tenancy family renters. What's the average tenant stay here, and is there a school-zone premium baked into asking?
- What's the average days-on-market for RENTAL listings here right now (not sales)? A rising rental-DOM trend means longer vacancies and softer asking-rent achievability than the comps imply.
- What's the recent tenant-quality profile in this submarket — average credit score on applications, eviction rate, late-payment / NSF rate, and stable-employment percentage? A property-management company in the area should have these aggregated.
- How much new apartment / multifamily construction is in the pipeline within 1–3 miles? Heavy new supply (>2% of stock underway) typically softens rents 12–24 months out; light construction supports rent growth.
Investment metrics
- 1% rule
- 1.47% ✓
- Cap rate
- 10.82%
- Cash-on-cash
- 16.16%
- DSCR
- 1.72
- GRM
- 5.7
CMA / ARV
- ARV (median comp)
- $484,622
- List price
- $349,900
- Delta
- -27.80%
- Verdict
- UNDERPRICED
- Comps
- 9 within 1.0 mi
Show comp detail 1 sale within ~0.75 mi
| Address | Dist | Beds/Ba | Sqft | Sold | Price | $/sf | Match |
|---|---|---|---|---|---|---|---|
| 428 Penora St | 0.58mi | 6/4.0 | 4,967 (-4%) | 9mo | $200,000 | $40 | 55 |
Match score weights: distance 35% · size 25% · config 20% · recency 20%. Top-matched comps best support the ARV.
Projected returns pro-forma
-3.0% appreciation · 3.0% rent growth · sell at horizon
- IRR
- 7.2%
- Equity multiple
- 1.28×
- Total profit
- $27,626
- Equity at exit
- $52,171
- IRR
- 16.6%
- Equity multiple
- 2.36×
- Total profit
- $133,396
- Equity at exit
- $30,253
Cash invested: $97,972 (down + closing). Projections, not guarantees.
Landlord ↔ Tenant lean methodology
- Overall (STATE)
- 15 Strongly Tenant-Friendly
- State New York
- 15 Strongly Tenant-Friendly · D+10
- County
- — inherits STATE
- City
- — inherits STATE
ZIP-level market 14086
- Home prices YoY
- -30.5%
- Active inventory
- 152
- Price-to-rent
- 17.0×
Monthly cashflow live
- Estimated rent
- $5,134 medium interval (Pro) →
- Mortgage (P&I)
- −$1,835
- Tax from tax record
- −$755 /mo · $9,065/yr
- Insurance
- −$146
- HOA
- −$0
- Vacancy / Maint / Mgmt
- −$1,078
- Net cashflow
- $1,320
Break-even live
3-unit breakdown (identical units grouped — click to expand)
| Units | Beds | Baths | Est. rent |
|---|---|---|---|
| 3× units | 3 | 1 | $5,133 |
| #1 | 3 | 1 | $1,711 |
| #2 | 3 | 1 | $1,711 |
| #3 | 3 | 1 | $1,711 |
| Total (3 units) | $5,134 | ||
UW: 25.0% down · 7.5% · 30yr · 1.5% tax · 5.0% vac · 8.0% maint · 8.0% mgmt
Financing live
Cash to close
- Down payment
- $87,475
- Closing costs
- $10,497
- Reserves months
- —
- Total cash needed
- —
Loan-product check · same deal, 3 products live
Conventional
25% down · 7.5% · 30yr
- Down + closing
- —
- Monthly P&I
- —
- Monthly cashflow
- —
- DSCR
- —
- Eligible?
- —
Personal DTI + credit; lowest rate.
DSCR
20% down · 8.5% · 30yr
- Down + closing
- —
- Monthly P&I
- —
- Monthly cashflow
- —
- DSCR
- —
- Eligible?
- —
No personal income docs; deal must DSCR.
Hard money
10% down · 12.0% · 12mo
- Down + closing
- —
- Monthly P&I
- —
- Monthly cashflow
- —
- DSCR
- —
- Eligible?
- —
Short-term bridge; refi at stabilization.
Listing history 7 events
-
2026-05-14status Pending 1802-char remark
-
2026-05-05$349,900 Active 1802-char remark
-
2020-03-17status Under Contract- Do Not Show
-
2020-03-14historical
-
2020-03-11price $219,900
-
2020-01-06price $259,900
-
2019-09-17$279,900 Active
ⓘ Source: listings_history table (triggers on properties + properties_extension) + one-shot
backfill from property_details.listing_events for pre-trigger history.
Tax reassessment forecast NY · Partial reset (capped growth)
- Current annual tax
- $9,065 · $755/mo
- Projected year-2 tax
- $9,065 · $755/mo
- Expected delta
- $0/yr ($0/mo · 0.0%)
ⓘ Screening estimate from a state-policy table — verify with the county assessor before closing.
Climate risk First Street
- Flood 5/10 Major FEMA zone X (unshaded) · 24% chance over 30 yrs
- Wildfire 2/10 Low
- Heat 2/10 Low 7 d/yr ≥92°F today · 15 d/yr by 30 yrs out
- Wind 1/10 Low
- Air quality 3/10 Moderate 2 unhealthy d/yr today · 3 by 30 yrs out
Nearby sold comps map
Loading sold comps map…
Walkable amenities ~0.75 mi
Loading nearby amenities…
Taxation est. · year 1
- Rental income
- $61,608
- − Mortgage interest
- −$19,600
- − Property taxes
- −$9,065
- − Insurance
- −$1,750
- − Repairs & maintenance
- −$4,929
- − Management
- −$4,929
- − Depreciation
- −$10,179
- Taxable income
- $11,157
- Est. tax owed @ 24.0%
- −$2,678
- After-tax cash flow
- $13,159/yr
For passive investors: Depreciation is non-cash, so a rental often shows a tax loss while cash-flowing — sheltering income. Rental losses are passive: they offset passive income freely, and up to $25,000/yr can offset ordinary (W-2) income if you actively participate and your MAGI is under $100k (phasing out to $0 by $150k); unused losses carry forward. On sale, claimed depreciation is recaptured at up to 25%, and gains may owe capital-gains tax (a 1031 exchange can defer both). Figures are a year-1 estimate at your 24.0% rate — not tax advice; consult a CPA.
Schools (NCES district)
- District
- Lancaster Central School District
- NCES district ID
- 3616680
- Math proficiency
- 57% ▼ -13.00%
- Reading proficiency
- 61% ▲ 2.00%
- Median HH income
- $64,668
- Composite
- 51.64/100
- National rank
- #1700
- State rank
- #234 of 590 in NY
Livability — Lancaster
- Score
- 78/100
- State rank
- #164
- US rank
- #2566
Category grades
Schools grade is shown separately in the Schools card above.
Census & demographics
- Census place
- Lancaster, NY
- County
- Erie County · 714,559 people
- City population
- 35,635
- Metro
- Buffalo-Cheektowaga, NY
- Population (ZIP)
- 35,635
- Household income
- $99,499
- Rent vs Own
- Severe rent burden
- 513.0
Population outlook (Erie County) Hauer SSP2
- Today (2025)
- 933,037 people
- By 2030
- 935,181 · +0.2%
- By 2040
- 928,531 · -0.5%
- By 2050
- 905,725 · -2.9%
- By 2075
- 834,037 · -10.6%
- By 2100
- 708,033 · -24.1%
Race, ethnicity, and origin ACS 2023
- Neighborhood character
- Predominantly White (95%)
- Race & ethnicity
- White 95% Two or more races 2% Black 1% Hispanic / Latino 1%
- Common ancestry
- Romanian 28% Lithuanian 2% Slovak 2%
- Foreign-born
- 3% · Canada
- Languages at home
- 96% English-only · Russian/Polish/Slavic 1% Other Indo-European 1% Arabic 1%
Political lean MEDSL · Erie
- 2024 margin
- Lean D (+9.7) · D 54.8% · R 45.2%
- 2008→2024 swing
- -7.9pp toward R · 2008: 17.5pp · 2024: 9.7pp
- All cycles
- 2024: D+9.7 2020: D+14.7 2016: D+4.8 2012: D+15.6 2008: D+17.5
Not yet ingested
- Civics
- —
Market trends
- HPI YoY
- ▼ -133.14%
- Current HPI
- 302.7484
- Rent YoY
- —
- Metro
- Buffalo-Cheektowaga, NY
- State GDP YoY
- ▲ 2.60%
- F500 in state
- 92
Industry mix (Fortune 500 HQ in NY)
| Industry | F500 HQs | Revenue |
|---|---|---|
| Financial Services | 10 | $950B |
|
||
| Consumer Goods | 9 | $162B |
|
||
| Insurance | 4 | $225B |
|
||
| Telecommunications | 2 | $144B |
|
||
| Pharmaceuticals | 2 | $112B |
|
||
| Media / Entertainment | 2 | $69B |
|
||
Price history
+25.0% since first listed7 events — show timeline
- 2026-05-14 Pending — WNYREIS
- 2026-05-05 Listed $349,900 WNYREIS
- 2020-03-17 Pending — WNYREIS
- 2020-03-14 Listing Removed — WNYREIS
- 2020-03-11 Price Changed $219,900 WNYREIS
- 2020-01-06 Price Changed $259,900 WNYREIS
- 2019-09-17 Listed $279,900 WNYREIS
Property tax history
+7.7%/yrLatest (2025): $9,065 · +2.6% YoY. Source: county tax records.
Cash-flow waterfall
monthlySold comps — $/sqft
last 12 mo · ≤1 miLoading sold comps…