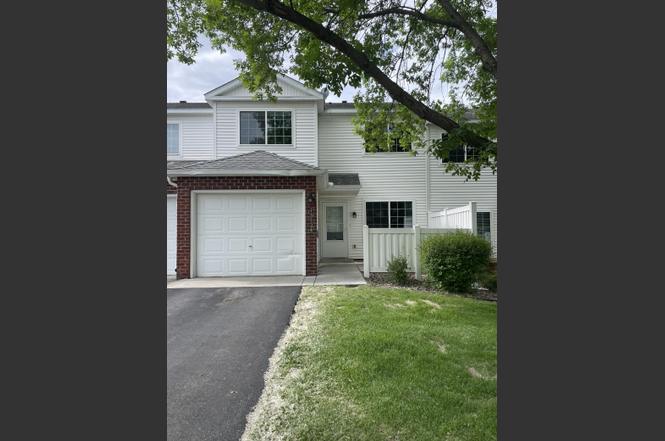
15724 Flackwood Trl
Apple Valley, MN 55124
$179,000D
2 bd · 2.0 ba ·
1,086 sqft ·
Built 1999
· Townhouse
· Active
· 109 DOM
Cashflow @ list (25.0% down · 7.5%)
Estimated rent
$1,995/mo
Mortgage (P&I)
−$939
Tax + insurance
−$298
HOA
−$420
Vac / Maint / Mgmt
−$419
Net cashflow
$-81/mo
Annual
$-973/yr
Cap rate
5.75%
Cash-on-cash
-1.94%
DSCR
0.91
1% rule
1.11%
Cash to close
$50,120
Investor read
- This is a 2-bed/2.0-bath townhouse listed at $179k.
- At list price, monthly cash flow is $-81 ($-973/yr) — negative.
- To cash-flow at today's rent, offer at most $167k (6.6% below list).
- Meets the 1% rule at list price ($2k rent vs $179k).
- It's been on market 109 days — a 9% lower offer ($163k) is reasonable based on typical stale-listing flexibility.
- Recommended offer: $163k (9.0% below list) — sets the bar for market timing.
- Local home prices are declining (-3.0%/yr); year-one equity from $1k of loan paydown is wiped out by about $5k of value loss. Plan a longer hold.
- Location reads 86/100 on livability (#10 in MN, #379 nationally) — a professional / high-income tenant draw. Strengths: commute A+, employment A+, housing A+; Watch: amenities F.
- Rosemount-Apple Valley-Eagan (suburban): math 50% / reading 58% proficiency, ranked #58 of 301 in MN (top 19%) — acceptable for families but not a draw, mixed tenant base, ~2y average lease; only 18% free/reduced lunch — higher-income household profile.
- Watch-outs: HOA is 21% of rent.
- Market conditions: Rents rising (+3.3%/yr); 276 active listings in the ZIP; 22 comparable units currently listed for rent nearby; rentals leasing fast (median 3d on market — plan ~1-2 weeks tenant-placement turnaround); solid renter incomes; 2,134 units permitted in Dakota County in 2024 (898 in 5+ unit buildings).
- Dakota County population projected at +11% by 2050 — modest demand growth; plan on rents tracking national, not racing it.
- 4 sale attempts since 23y ago; this cycle's ask has dropped $40k (18%) from the opening price — seller is motivated, your offer sets the floor, not the list.
- Current owner paid $152k; 18% above their basis — modest negotiation headroom, anchor on the comps not their cost.
- Cap rate 5.7% vs local median 4.0% in Apple Valley — top-decile yield for the area; either an underpriced asset or a hidden risk that comps aren't pricing in. Stress-test before assuming the spread holds.
Questions for listing agent
- What do current leases actually rent for vs. the listed asking? Can we see a recent rent roll and the last 12 months of T-12 income?
- It's been on market 109 days. Have you received any prior offers? Is the seller open to a 9% concession, seller financing, or rate buy-down credit?
- What does the HOA fee cover, when was the last increase, and are there any pending special assessments or reserve-fund shortfalls?
- Why hasn't it sold? Are there any deal-killer items the seller is aware of (foundation, flood, title, zoning, code violations)?
- Is there a deadline driving the sale (1031 exchange, divorce, estate, relocation)? That informs how much negotiation room exists.
- Schools are B-rated — typically a magnet for longer-tenancy family renters. What's the average tenant stay here, and is there a school-zone premium baked into asking?
- The area grade is low — what's the realistic commute time and amenity access for the typical tenant pool here? Any planned neighborhood developments (good or bad) we should know about?
- What's the average days-on-market for RENTAL listings here right now (not sales)? A rising rental-DOM trend means longer vacancies and softer asking-rent achievability than the comps imply.
CashFlowRE · CFR-1C8GK64PYCJG4G
· Data 11 h ago
cashflowre.app · 2026-05-29