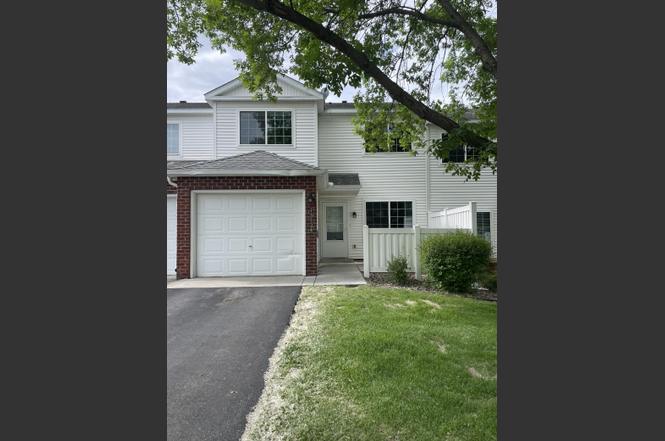
15724 Flackwood Trl · Apple Valley, MN
Flood risk 1/10 · Minimal
- FEMA flood zone
- X (unshaded)
- Chance of flooding over 30 yrs
- 0.0%
- Est. flood insurance / yr
- $507 – $1,088
Fire risk 1/10 · Minimal
- Est. fire insurance / yr
- $888 – $1,650
Heat risk 2/10 · Minimal
- Hot days now (above 99°F)
- 7 days/yr
- Hot days in 30 yrs
- 14 days/yr
Wind risk 2/10 · Minimal
- Chance of severe wind over 30 yrs
- —
Air-quality risk 2/10 · Minimal
- Unhealthy air days now
- 1 days/yr
- Unhealthy air days in 30 yrs
- 1 days/yr
Risk factors via First Street. Map © Google.
Why this score? — see what drove the D grade
The composite is a weighted blend of 9 inputs, each scored 0–100. Each bar is that input's sub-score; the figure is the points it added to the 100-point composite (weight × sub-score).
- Cash flow +10.8/30.0
- ARV discount +7.5/15.0
- 1% rule +6.1/10.0
- Schools +4.9/10.0
- Livability +4.3/5.0
- Rent growth +3.3/5.0
- DSCR +3.1/10.0
- Condition / age +2.5/5.0
- Appreciation +0.0/10.0
$179,000
🖨 Deal sheet (PDF) 📄 Offer letter ✓ Due diligence
Key facts
- $420 HOA
- Garage
- Built 1999
Property features AI
Finance
- HOA & community: HOA managed by First Service Residential; Monthly association fee of $420; HOA covers cable TV, hazard insurance, internet, lawn care, grounds maintenance, sewer, shared amenities, and water
Exterior
- Parking: Attached garage with garage door opener; Asphalt driveway; 1 garage space
- Utilities: City water connected; City sewer connected; Natural gas
- Home design: Attached residential property; Two levels; Main entry on main level
- Construction: Slab foundation; Foundation area 620; Above-grade finished area 1,086
- Exterior features: Patio; Metal and vinyl exterior; Paved street frontage; No fencing
Interior
- Kitchen: Dishwasher; Microwave; Range; Refrigerator
- Bedrooms: 2 bedrooms (upper level)
- Flooring: Tile floors
- Bathrooms: 1 full bath (upper level); 1 half bath (main floor)
- Heating & cooling: Forced air heating; Central air conditioning
- Interior features: Informal dining area; Walk-in closet; No basement
- Laundry & utility: In-unit washer and dryer; Washer/Dryer hookup
Neighborhood map
What this means for you Summary
Snapshot
- This is a 2-bed/2.0-bath townhouse listed at $179k.
Deal economics
- At list price, monthly cash flow is $-82 ($-978/yr) — negative.
- To cash-flow at today's rent, offer at most $167k (6.6% below list).
- Meets the 1% rule at list price ($2k rent vs $179k).
- Recommended offer: $163k (9.0% below list) — sets the bar for market timing.
- Cap rate 5.7% vs local median 4.0% in Apple Valley — top-decile yield for the area; either an underpriced asset or a hidden risk that comps aren't pricing in. Stress-test before assuming the spread holds.
Location & tenants
- Location reads 86/100 on livability (#10 in MN, #379 nationally) — a professional / high-income tenant draw. Strengths: commute A+, employment A+, housing A+; Watch: amenities F.
- Rosemount-Apple Valley-Eagan (suburban): math 50% / reading 58% proficiency, ranked #58 of 301 in MN (top 19%) — acceptable for families but not a draw, mixed tenant base, ~2y average lease; only 18% free/reduced lunch — higher-income household profile.
- Market conditions: Rents rising (+3.3%/yr); 276 active listings in the ZIP; 22 comparable units currently listed for rent nearby; rentals leasing fast (median 3d on market — plan ~1-2 weeks tenant-placement turnaround); solid renter incomes; 2,134 units permitted in Dakota County in 2024 (898 in 5+ unit buildings).
Forward outlook
- Local home prices are declining (-3.0%/yr); year-one equity from $1k of loan paydown is wiped out by about $5k of value loss. Plan a longer hold.
- Dakota County population projected at +11% by 2050 — modest demand growth; plan on rents tracking national, not racing it.
Negotiation context
- It's been on market 109 days — a 9% lower offer ($163k) is reasonable based on typical stale-listing flexibility.
- 4 sale attempts since 23y ago; this cycle's ask has dropped $40k (18%) from the opening price — seller is motivated, your offer sets the floor, not the list.
- Current owner paid $152k; 18% above their basis — modest negotiation headroom, anchor on the comps not their cost.
Risks & watch-outs
- Watch-outs: HOA is 21% of rent.
Questions for the listing agent
- What do current leases actually rent for vs. the listed asking? Can we see a recent rent roll and the last 12 months of T-12 income?
- It's been on market 109 days. Have you received any prior offers? Is the seller open to a 9% concession, seller financing, or rate buy-down credit?
- What does the HOA fee cover, when was the last increase, and are there any pending special assessments or reserve-fund shortfalls?
- Why hasn't it sold? Are there any deal-killer items the seller is aware of (foundation, flood, title, zoning, code violations)?
- Is there a deadline driving the sale (1031 exchange, divorce, estate, relocation)? That informs how much negotiation room exists.
- Schools are B-rated — typically a magnet for longer-tenancy family renters. What's the average tenant stay here, and is there a school-zone premium baked into asking?
- The area grade is low — what's the realistic commute time and amenity access for the typical tenant pool here? Any planned neighborhood developments (good or bad) we should know about?
- What's the average days-on-market for RENTAL listings here right now (not sales)? A rising rental-DOM trend means longer vacancies and softer asking-rent achievability than the comps imply.
- What's the recent tenant-quality profile in this submarket — average credit score on applications, eviction rate, late-payment / NSF rate, and stable-employment percentage? A property-management company in the area should have these aggregated.
- How much new for-sale + rental construction is in the pipeline within 1–3 miles? Heavy new supply typically softens prices + rents 12–24 months out; constrained supply supports both.
Investment metrics
- 1% rule
- 1.11% ✓
- Cap rate
- 5.75%
- Cash-on-cash
- -1.95%
- DSCR
- 0.91
- GRM
- 7.5
CMA / ARV
No comps found within radius.
Projected returns pro-forma
-3.0% appreciation · 3.27% rent growth · sell at horizon
- IRR
- -18.9%
- Equity multiple
- 0.33×
- Total profit
- $-33,366
- Equity at exit
- $26,689
- IRR
- -10.4%
- Equity multiple
- 0.36×
- Total profit
- $-32,326
- Equity at exit
- $15,477
Cash invested: $50,120 (down + closing). Projections, not guarantees.
Landlord ↔ Tenant lean methodology
- Overall (STATE)
- 46 Balanced
- State Minnesota
- 46 Balanced · D+2
- County
- — inherits STATE
- City
- — inherits STATE
ZIP-level market 55124
- Rents YoY
- 3.3%
- Active inventory
- 276
- Price-to-rent
- 7.5×
Monthly cashflow live
- Estimated rent
- $1,994 high interval (Pro) →
- Mortgage (P&I)
- −$939
- Tax est. 1.5%
- −$224 /mo · $2,685/yr
- Insurance
- −$75
- HOA
- −$420
- Vacancy / Maint / Mgmt
- −$419
- Net cashflow
- $-82
Break-even live
Sensitivity live
| Price | -10% $42 | -5% $-20 | +0% $-82 | +5% $-143 | +10% $-205 |
|---|---|---|---|---|---|
| Rent | -10% $-239 | -5% $-160 | +0% $-82 | +5% $-3 | +10% $76 |
| Rate | -1.0pp $9 | -0.5pp $-36 | base $-82 | +0.5pp $-128 | +1.0pp $-175 |
UW: 25.0% down · 7.5% · 30yr · 1.5% tax · 5.0% vac · 8.0% maint · 8.0% mgmt
Financing live
Cash to close
- Down payment
- $44,750
- Closing costs
- $5,370
- Reserves months
- —
- Total cash needed
- —
Loan-product check · same deal, 3 products live
Conventional
25% down · 7.5% · 30yr
- Down + closing
- —
- Monthly P&I
- —
- Monthly cashflow
- —
- DSCR
- —
- Eligible?
- —
Personal DTI + credit; lowest rate.
DSCR
20% down · 8.5% · 30yr
- Down + closing
- —
- Monthly P&I
- —
- Monthly cashflow
- —
- DSCR
- —
- Eligible?
- —
No personal income docs; deal must DSCR.
Hard money
10% down · 12.0% · 12mo
- Down + closing
- —
- Monthly P&I
- —
- Monthly cashflow
- —
- DSCR
- —
- Eligible?
- —
Short-term bridge; refi at stabilization.
Rent comps 22 comps
| Address | Beds | Baths | Sqft | Rent | $/sqft | DOM | Units | Dist |
|---|---|---|---|---|---|---|---|---|
| 15782 Flackwood Trl Apple Valley, MN | 3.0 | 1.5 | 1400 | $1,995 | $1.43 | 21d | 1 | 0.05mi |
| 6444 158th St W Apple Valley, MN | 2.0 | 2.5 | 1260 | $1,889 | $1.50 | 3d | 1 | 0.23mi |
| 15734 Foliage Ave Saint Paul, MN | 1.0–3.0 | 1.0–2.0 | 1130 | $1,810 | $1.60 | 0d | 15 | 0.28mi |
| 15539 Float Ln Apple Valley, MN | 2.0 | 1.5 | 927 | $1,795 | $1.94 | 25d | 1 | 0.30mi |
| 15531 Flyboat Ln Apple Valley, MN | 2.0 | 1.5 | 1010 | $1,865 | $1.85 | 25d | 1 | 0.33mi |
| 15482 Flight Way Apple Valley, MN | 2.0 | 1.0 | 1190 | $1,825 | $1.53 | 0d | 1 | 0.34mi |
| 15482 Flight Way Apple Valley, MN | 2.0 | 1.0 | 1190 | $1,825 | $1.53 | 3d | 1 | 0.34mi |
| 15533 Flight Way Apple Valley, MN | 2.0 | 1.5 | 976 | $1,995 | $2.04 | 25d | 1 | 0.40mi |
| 15600 Galaxie Ave Saint Paul, MN | 1.0–3.0 | 1.0–2.0 | 1244 | $1,642 | $1.32 | 0d | 7 | 0.60mi |
| 6780 Fortino St Saint Paul, MN | 1.0–2.0 | 1.0–2.0 | 1117 | $4,085 | $3.66 | 0d | 12 | 0.62mi |
| 15283 Galante Ln Saint Paul, MN | 2.0 | 1.0–2.0 | 880 | $2,250 | $2.56 | 0d | 17 | 0.77mi |
| 6859 152nd St W Apple Valley, MN | 1.0–3.0 | 1.0–2.0 | 1062 | $2,022 | $1.90 | 0d | 13 | 0.78mi |
| 15380 Garrett Ave Saint Paul, MN | 1.0–2.0 | 1.0–3.0 | 1676 | $3,296 | $1.97 | 3d | 10 | 0.86mi |
| 7472 157th St W Apple Valley, MN | 1.0–3.0 | 1.0–2.0 | 1031 | $1,468 | $1.42 | 0d | 2 | 0.98mi |
| 15899 Elmhurst Ln Saint Paul, MN | 3.0 | 1.0–2.0 | 1031 | $2,268 | $2.20 | 0d | 14 | 1.08mi |
| 7624 157th St W Apple Valley, MN | 1.0 | 1.0 | 720 | $1,395 | $1.94 | 25d | 1 | 1.21mi |
| 14650 Foliage Ave Saint Paul, MN | 3.0 | 1.0–2.0 | 978 | $2,263 | $2.31 | 0d | 24 | 1.27mi |
| 5181 161st St W Lakeville, MN | 1.0–3.0 | 1.0–2.0 | 1044 | $1,973 | $1.89 | 0d | 4 | 1.29mi |
| 7802 Whitney Dr Apple Valley, MN | 2.0 | 1.0 | 1000 | $1,400 | $1.40 | 25d | 2 | 1.31mi |
| 5076 161st St W Lakeville, MN | 1.0–3.0 | 1.0–2.0 | 1186 | $2,203 | $1.86 | 0d | 14 | 1.32mi |
| 7824 Whitney Dr Apple Valley, MN | 2.0 | 2.0 | 1250 | $1,750 | $1.40 | 4d | 1 | 1.37mi |
| 16947 Garcia Way Unit 2 Rosemount, MN | 2.0 | 1.0 | 900 | $1,595 | $1.77 | 17d | 1 | 1.48mi |
HOA detail
- Monthly dues
- $420 · $5,040/yr
Listing history 26 events
-
2026-06-21days on market $179,000 Active 109 DOM
-
2026-06-18days on market $179,000 Active 106 DOM
-
2026-06-17days on market $179,000 Active 105 DOM
-
2026-06-16days on market $179,000 Active 104 DOM
-
2026-06-15days on market $179,000 Active 103 DOM
-
2026-06-13days on market $179,000 Active 101 DOM
-
2026-06-13days on market $179,000 Active 100 DOM
-
2026-06-09days on market $179,000 Active 97 DOM
-
2026-06-08pricedays on market $179,000 Active 96 DOM
-
2026-06-07days on market $189,000 Active 95 DOM
-
2026-06-04days on market $189,000 Active 92 DOM
-
2026-06-03days on market $189,000 Active 91 DOM
-
2026-06-02days on market $189,000 Active 90 DOM
-
2026-06-01days on market $189,000 Active 89 DOM
-
2026-05-31days on market $189,000 Active 88 DOM
-
2026-04-24price $199,900
-
2026-03-31price $209,000
-
2026-03-05$219,000 Active
-
2026-03-02historical $219,000
-
2008-01-28historical
-
2007-08-06$149,900
-
2007-08-04historical
-
2007-02-04$154,900
-
2003-08-08soldstatus $152,000
-
2003-07-01historical
-
2003-06-25$147,500
ⓘ Source: listings_history table (triggers on properties + properties_extension) + one-shot
backfill from property_details.listing_events for pre-trigger history.
Climate risk First Street
- Flood 1/10 Low FEMA zone X (unshaded) · 0% chance over 30 yrs
- Wildfire 1/10 Low
- Heat 2/10 Low 7 d/yr ≥99°F today · 14 d/yr by 30 yrs out
- Wind 2/10 Low
- Air quality 2/10 Low 1 unhealthy d/yr today · 1 by 30 yrs out
Nearby sold comps map
Loading sold comps map…
Walkable amenities ~0.75 mi
Loading nearby amenities…
Taxation est. · year 1
- Rental income
- $23,932
- − Mortgage interest
- −$10,027
- − Property taxes
- −$2,685
- − Insurance
- −$895
- − Repairs & maintenance
- −$1,915
- − Management
- −$1,915
- − HOA
- −$5,040
- − Depreciation
- −$5,207
- Taxable loss
- −$3,751
- Est. tax savings @ 24.0%
- +$900
- After-tax cash flow
- $-78/yr
For passive investors: Depreciation is non-cash, so a rental often shows a tax loss while cash-flowing — sheltering income. Rental losses are passive: they offset passive income freely, and up to $25,000/yr can offset ordinary (W-2) income if you actively participate and your MAGI is under $100k (phasing out to $0 by $150k); unused losses carry forward. On sale, claimed depreciation is recaptured at up to 25%, and gains may owe capital-gains tax (a 1031 exchange can defer both). Figures are a year-1 estimate at your 24.0% rate — not tax advice; consult a CPA.
Schools (NCES district)
- District
- Rosemount-Apple Valley-Eagan
- NCES district ID
- 2732390
- Math proficiency
- 50% ▼ -14.00%
- Reading proficiency
- 58% ▼ -7.00%
- Median HH income
- $85,559
- Composite
- 49.48/100
- National rank
- #2000
- State rank
- #58 of 301 in MN
Livability — Apple Valley
- Score
- 86/100
- State rank
- #10
- US rank
- #379
Category grades
Schools grade is shown separately in the Schools card above.
Census & demographics
- Census place
- Apple Valley, MN
- County
- Dakota County · 417,704 people
- City population
- 55,658
- Metro
- Minneapolis-St. Paul-Bloomington, MN-WI
- Population (ZIP)
- 55,658
- Household income
- $97,727
- Rent vs Own
- Severe rent burden
- 1406.0
Population outlook (Dakota County) Hauer SSP2
- Today (2025)
- 450,671 people
- By 2030
- 465,068 · +3.2%
- By 2040
- 486,770 · +8.0%
- By 2050
- 498,743 · +10.7%
- By 2075
- 533,865 · +18.5%
- By 2100
- 550,133 · +22.1%
Race, ethnicity, and origin ACS 2023
- Neighborhood character
- Predominantly White (69%)
- Race & ethnicity
- White 69% Black 10% Two or more races 9% Hispanic / Latino 7% Asian 6%
- Hispanic origin (detail)
- Mexican 4% Dominican 1%
- Common ancestry
- Portuguese 10% Romanian 3% Italian 3%
- Foreign-born
- 12% · Canada, China, Vietnam
- Languages at home
- 85% English-only · Spanish 5% Other Asian/Pacific 2% Other Indo-European 1%
Political lean MEDSL · Dakota
- 2024 margin
- D (+12.9) · D 55.4% · R 42.5% · Other 2.1%
- 2008→2024 swing
- +7.4pp toward D · 2008: 5.5pp · 2024: 12.9pp
- All cycles
- 2024: D+12.9 2020: D+13.9 2016: D+4.7 2012: D+2.9 2008: D+5.5
Not yet ingested
- Civics
- —
Market trends
- HPI YoY
- ▼ -275.56%
- Current HPI
- 227.4734
- Rent YoY
- ▲ 3.27%
- Metro
- Minneapolis-St. Paul-Bloomington, MN-WI
- State GDP YoY
- ▲ 2.41%
- F500 in state
- 34
Industry mix (Fortune 500 HQ in MN)
| Industry | F500 HQs | Revenue |
|---|---|---|
| Healthcare | 2 | $407B |
|
||
| Retail | 2 | $150B |
|
||
| Consumer Goods | 2 | $32B |
|
||
| Industrial Machinery | 2 | $6B |
|
||
| Agriculture | 1 | $40B |
|
||
| Healthcare / Medical Devices | 1 | $32B |
|
||
Price history
+35.5% since first listed11 events — show timeline
- 2026-04-24 Price Changed $199,900 NORTHSTARMLS as Distributed by MLS Grid
- 2026-03-31 Price Changed $209,000 NORTHSTARMLS as Distributed by MLS Grid
- 2026-03-05 Listed $219,000 NORTHSTARMLS as Distributed by MLS Grid
- 2026-03-02 Coming Soon $219,000 NORTHSTARMLS as Distributed by MLS Grid
- 2008-01-28 Listing Removed — NORTHSTARMLS as Distributed by MLS Grid
- 2007-08-06 Listed $149,900 NORTHSTARMLS as Distributed by MLS Grid
- 2007-08-04 Listing Removed — NORTHSTARMLS as Distributed by MLS Grid
- 2007-02-04 Listed $154,900 NORTHSTARMLS as Distributed by MLS Grid
- 2003-08-08 Sold (MLS) $152,000 NORTHSTARMLS as Distributed by MLS Grid
- 2003-07-01 Listing Removed — NORTHSTARMLS as Distributed by MLS Grid
- 2003-06-25 Listed $147,500 NORTHSTARMLS as Distributed by MLS Grid
Cash-flow waterfall
monthlySold comps — $/sqft
last 12 mo · ≤1 miLoading sold comps…