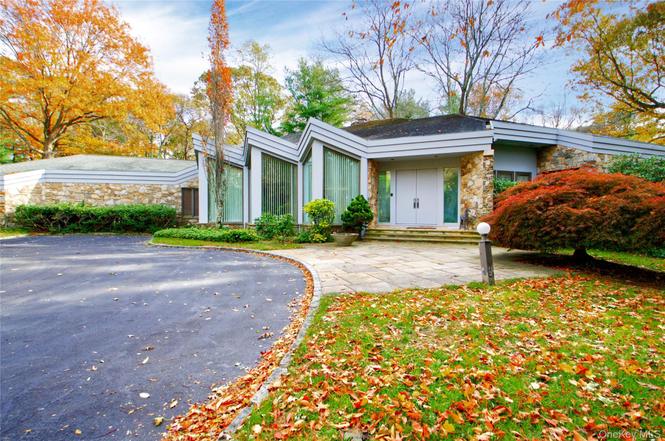
7 Pin Oak Ct
Old Brookville, NY 11545
$2,799,000D+
5 bd · 3.5 ba ·
4,498 sqft ·
Built 1987
· SingleFamily
· Pending
· 121 DOM
Cashflow @ list (25.0% down · 7.5%)
Estimated rent
$21,500/mo
Mortgage (P&I)
−$14,678
Tax + insurance
−$3,359
HOA
−$0
Vac / Maint / Mgmt
−$4,515
Net cashflow
$-1,053/mo
Annual
$-12,631/yr
Cap rate
5.84%
Cash-on-cash
-1.61%
DSCR
0.93
1% rule
0.77%
Cash to close
$783,720
Investor read
- This is a 5-bed/3.5-bath single-family listed at $2.80M.
- At list price, monthly cash flow is $-1k ($-13k/yr) — negative.
- To cash-flow at today's rent, offer at most $2.61M (6.6% below list).
- To meet the 1% rule (rent ≥ 1% of price), the offer needs to be $2.15M (23.2% below list).
- It's been on market 121 days — a 12% lower offer ($2.46M) is reasonable based on typical stale-listing flexibility.
- Recommended offer: $2.15M (23.2% below list) — sets the bar for 1% rule.
- Local home prices are declining (-3.0%/yr); year-one equity from $19k of loan paydown is wiped out by about $84k of value loss. Plan a longer hold.
- Location reads 56/100 on livability (#1,119 in NY) — a working-class tenant base; expect higher turnover. Strengths: crime A+, employment A+; Watch: housing D+, amenities F, commute F.
- Locust Valley Central School District (suburban): math 83% / reading 79% proficiency, ranked #38 of 590 in NY (top 6%) — strong family-tenant draw, lease renewals of 3-5y typical; only 12% free/reduced lunch — higher-income household profile.
- Zoned schools: Ann Macarthur Primary (200 students, 18% FRL); Locust Valley Middle School (math 77% / reading 72%, grade A, #61 of 729 statewide, top 9%, 472 students, 17% FRL); Locust Valley High School (math 98% / reading 92%, grade A+, #93 of 1,100 statewide, top 10%, 629 students, 22% FRL).
- Market conditions: 112 active listings in the ZIP; 1 comparable units currently listed for rent nearby; 824 units permitted in Nassau County in 2024 (153 in 5+ unit buildings).
- Nassau County population projected at +7% by 2050 — modest demand growth; plan on rents tracking national, not racing it.
- 2 sale attempts since 7y ago with the ask held roughly flat each time — persistent listings suggest the price (not the market) is what's stuck; bring a comps-based counter.
- Climate carrying-cost: major wind risk, 68% chance of damaging wind over 30y; extreme-heat days projected 7→16/yr by 2055 (HVAC capex compounding) — expect insurance premiums to compound above CPI over the hold.
Questions for listing agent
- What do current leases actually rent for vs. the listed asking? Can we see a recent rent roll and the last 12 months of T-12 income?
- It's been on market 121 days. Have you received any prior offers? Is the seller open to a 23% concession, seller financing, or rate buy-down credit?
- Why hasn't it sold? Are there any deal-killer items the seller is aware of (foundation, flood, title, zoning, code violations)?
- Is there a deadline driving the sale (1031 exchange, divorce, estate, relocation)? That informs how much negotiation room exists.
- The area grade is low — what's the realistic commute time and amenity access for the typical tenant pool here? Any planned neighborhood developments (good or bad) we should know about?
- What's the average days-on-market for RENTAL listings here right now (not sales)? A rising rental-DOM trend means longer vacancies and softer asking-rent achievability than the comps imply.
- What's the recent tenant-quality profile in this submarket — average credit score on applications, eviction rate, late-payment / NSF rate, and stable-employment percentage? A property-management company in the area should have these aggregated.
- How much new for-sale + rental construction is in the pipeline within 1–3 miles? Heavy new supply typically softens prices + rents 12–24 months out; constrained supply supports both.
CashFlowRE · CFR-1D9GA6D6W1J6DZ
· Data 4 weeks ago
cashflowre.app · 2026-05-29