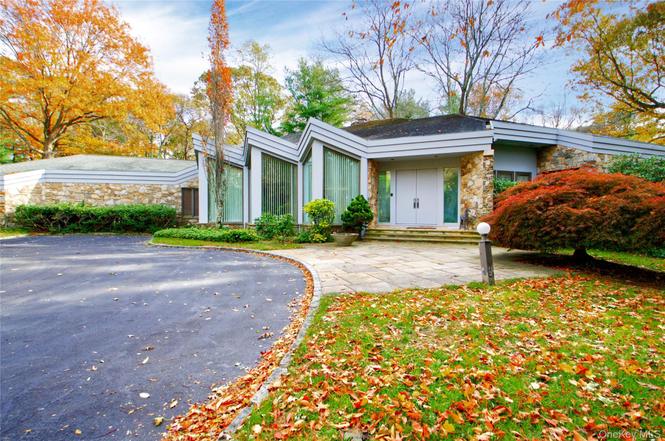
7 Pin Oak Ct · Old Brookville, NY
Flood risk 4/10 · Minor
- FEMA flood zone
- X (unshaded)
- Chance of flooding over 30 yrs
- 0.2%
- Est. flood insurance / yr
- $473 – $860
Fire risk 3/10 · Minor
- Est. fire insurance / yr
- $691 – $1,283
Heat risk 5/10 · Moderate
- Hot days now (above 97°F)
- 7 days/yr
- Hot days in 30 yrs
- 16 days/yr
Wind risk 6/10 · Moderate
- Chance of severe wind over 30 yrs
- 68.0%
Air-quality risk 4/10 · Minor
- Unhealthy air days now
- 4 days/yr
- Unhealthy air days in 30 yrs
- 5 days/yr
Risk factors via First Street. Map © Google.
Why this score? — see what drove the D+ grade
The composite is a weighted blend of 9 inputs, each scored 0–100. Each bar is that input's sub-score; the figure is the points it added to the 100-point composite (weight × sub-score).
- ARV discount +13.1/15.0
- Cash flow +11.2/30.0
- Schools +7.4/10.0
- DSCR +3.3/10.0
- Livability +2.8/5.0
- 1% rule +2.7/10.0
- Rent growth +2.5/5.0
- Condition / age +2.5/5.0
- Appreciation +0.0/10.0
$2,799,000
🖨 Deal sheet (PDF) 📄 Offer letter ✓ Due diligence
Listing remarks
Tucked at the end of a quiet cul-de-sac, this timeless contemporary sits on two perfectly level acres offering exceptional privacy and a deep, usable yard. The property features an in-ground heated pool with a waterfall and beautiful outdoor space ideal for gatherings or relaxation. Inside, the home provides plenty of opportunity with its dramatic ceilings and walls of glass that create a bright, open feel throughout. The sunken living room flows into a dining area with a wet bar. The first floor includes a spacious primary suite, a dedicated home office, and both formal and casual living areas—all thoughtfully laid out and generously proportioned. With its solid foundation and impres
Key facts
- Wet bar
- Waterfall
- Primary suite
Tags
Neighborhood map
What this means for you Summary
Snapshot
- This is a 5-bed/3.5-bath single-family listed at $2.80M.
Deal economics
- At list price, monthly cash flow is $-1k ($-13k/yr) — negative.
- To cash-flow at today's rent, offer at most $2.61M (6.6% below list).
- To meet the 1% rule (rent ≥ 1% of price), the offer needs to be $2.15M (23.2% below list).
- Recommended offer: $2.15M (23.2% below list) — sets the bar for 1% rule.
Location & tenants
- Location reads 56/100 on livability (#1,119 in NY) — a working-class tenant base; expect higher turnover. Strengths: crime A+, employment A+; Watch: housing D+, amenities F, commute F.
- Locust Valley Central School District (suburban): math 83% / reading 79% proficiency, ranked #38 of 590 in NY (top 6%) — strong family-tenant draw, lease renewals of 3-5y typical; only 12% free/reduced lunch — higher-income household profile.
- Zoned schools: Ann Macarthur Primary (200 students, 18% FRL); Locust Valley Middle School (math 77% / reading 72%, grade A, #61 of 729 statewide, top 9%, 472 students, 17% FRL); Locust Valley High School (math 98% / reading 92%, grade A+, #93 of 1,100 statewide, top 10%, 629 students, 22% FRL).
- Market conditions: 112 active listings in the ZIP; 1 comparable units currently listed for rent nearby; 824 units permitted in Nassau County in 2024 (153 in 5+ unit buildings).
Forward outlook
- Local home prices are declining (-3.0%/yr); year-one equity from $19k of loan paydown is wiped out by about $84k of value loss. Plan a longer hold.
- Nassau County population projected at +7% by 2050 — modest demand growth; plan on rents tracking national, not racing it.
Negotiation context
- It's been on market 121 days — a 12% lower offer ($2.46M) is reasonable based on typical stale-listing flexibility.
- 2 sale attempts since 7y ago with the ask held roughly flat each time — persistent listings suggest the price (not the market) is what's stuck; bring a comps-based counter.
Risks & watch-outs
- Climate carrying-cost: major wind risk, 68% chance of damaging wind over 30y; extreme-heat days projected 7→16/yr by 2055 (HVAC capex compounding) — expect insurance premiums to compound above CPI over the hold.
Questions for the listing agent
- What do current leases actually rent for vs. the listed asking? Can we see a recent rent roll and the last 12 months of T-12 income?
- It's been on market 121 days. Have you received any prior offers? Is the seller open to a 23% concession, seller financing, or rate buy-down credit?
- Why hasn't it sold? Are there any deal-killer items the seller is aware of (foundation, flood, title, zoning, code violations)?
- Is there a deadline driving the sale (1031 exchange, divorce, estate, relocation)? That informs how much negotiation room exists.
- The area grade is low — what's the realistic commute time and amenity access for the typical tenant pool here? Any planned neighborhood developments (good or bad) we should know about?
- What's the average days-on-market for RENTAL listings here right now (not sales)? A rising rental-DOM trend means longer vacancies and softer asking-rent achievability than the comps imply.
- What's the recent tenant-quality profile in this submarket — average credit score on applications, eviction rate, late-payment / NSF rate, and stable-employment percentage? A property-management company in the area should have these aggregated.
- How much new for-sale + rental construction is in the pipeline within 1–3 miles? Heavy new supply typically softens prices + rents 12–24 months out; constrained supply supports both.
Investment metrics
- 1% rule
- 0.77% ✗
- Cap rate
- 5.84%
- Cash-on-cash
- -1.61%
- DSCR
- 0.93
- GRM
- 10.8
CMA / ARV
- ARV (on-the-fly)
- $3,198,078
- Comps found
- 3
Show comp detail 3 sales within ~0.75 mi
| Address | Dist | Beds/Ba | Sqft | Sold | Price | $/sf | Match |
|---|---|---|---|---|---|---|---|
| 51 Linden Ln | 0.57mi | 5/4.5 | 4,934 (+10%) | 0mo | $3,900,000 | $790 | 53 |
| 770 Chicken Valley Rd | 0.65mi | 5/5.0 | 4,782 (+6%) | 11mo | $3,400,000 | $711 | 44 |
| 1281 Wolver Hollow Rd | 0.72mi | 4/4.5 (-1) | 4,550 (+1%) | 16mo | $2,400,000 | $527 | 42 |
Match score weights: distance 35% · size 25% · config 20% · recency 20%. Top-matched comps best support the ARV.
Projected returns pro-forma
-3.0% appreciation · 3.0% rent growth · sell at horizon
- IRR
- -19.0%
- Equity multiple
- 0.34×
- Total profit
- $-521,073
- Equity at exit
- $417,340
- IRR
- -11.6%
- Equity multiple
- 0.31×
- Total profit
- $-542,004
- Equity at exit
- $242,006
Cash invested: $783,720 (down + closing). Projections, not guarantees.
Landlord ↔ Tenant lean methodology
- Overall (STATE)
- 15 Strongly Tenant-Friendly
- State New York
- 15 Strongly Tenant-Friendly · D+10
- County
- — inherits STATE
- City
- — inherits STATE
ZIP-level market 11545
- Home prices YoY
- -30.8%
- Active inventory
- 112
- Price-to-rent
- 10.8×
Monthly cashflow live
- Estimated rent
- $21,500 medium interval (Pro) →
- Mortgage (P&I)
- −$14,678
- Tax from tax record
- −$2,193 /mo · $26,316/yr
- Insurance
- −$1,166
- HOA
- −$0
- Vacancy / Maint / Mgmt
- −$4,515
- Net cashflow
- $-1,053
Break-even live
Sensitivity live
| Price | -10% $532 | -5% $-260 | +0% $-1,053 | +5% $-1,845 | +10% $-2,637 |
|---|---|---|---|---|---|
| Rent | -10% $-2,751 | -5% $-1,902 | +0% $-1,053 | +5% $-203 | +10% $646 |
| Rate | -1.0pp $357 | -0.5pp $-341 | base $-1,053 | +0.5pp $-1,778 | +1.0pp $-2,516 |
UW: 25.0% down · 7.5% · 30yr · 1.5% tax · 5.0% vac · 8.0% maint · 8.0% mgmt
Financing live
Cash to close
- Down payment
- $699,750
- Closing costs
- $83,970
- Reserves months
- —
- Total cash needed
- —
Loan-product check · same deal, 3 products live
Conventional
25% down · 7.5% · 30yr
- Down + closing
- —
- Monthly P&I
- —
- Monthly cashflow
- —
- DSCR
- —
- Eligible?
- —
Personal DTI + credit; lowest rate.
DSCR
20% down · 8.5% · 30yr
- Down + closing
- —
- Monthly P&I
- —
- Monthly cashflow
- —
- DSCR
- —
- Eligible?
- —
No personal income docs; deal must DSCR.
Hard money
10% down · 12.0% · 12mo
- Down + closing
- —
- Monthly P&I
- —
- Monthly cashflow
- —
- DSCR
- —
- Eligible?
- —
Short-term bridge; refi at stabilization.
Rent comps 1 comps
| Address | Beds | Baths | Sqft | Rent | $/sqft | DOM | Units | Dist |
|---|---|---|---|---|---|---|---|---|
| 8 Plaka Ct Glen Head, NY | 6.0 | 6.0 | 5100 | $21,500 | $4.22 | 0d | 1 | 1.44mi |
Listing history 4 events
-
2026-03-25status Pending
-
2025-11-24$2,799,000 Active
-
2020-07-08historical
-
2019-07-13$2,099,000 New
ⓘ Source: listings_history table (triggers on properties + properties_extension) + one-shot
backfill from property_details.listing_events for pre-trigger history.
Tax reassessment forecast NY · Partial reset (capped growth)
- Current annual tax
- $26,316 · $2,193/mo
- Projected year-2 tax
- $36,810 · $3,067/mo
- Expected delta
- +$10,493/yr (+$874/mo · 39.9%)
ⓘ Screening estimate from a state-policy table — verify with the county assessor before closing.
Climate risk First Street
- Flood 4/10 Moderate FEMA zone X (unshaded) · 20% chance over 30 yrs
- Wildfire 3/10 Moderate
- Heat 5/10 Major 7 d/yr ≥97°F today · 16 d/yr by 30 yrs out
- Wind 6/10 Major 68% chance of damaging wind over 30 yrs
- Air quality 4/10 Moderate 4 unhealthy d/yr today · 5 by 30 yrs out
Nearby sold comps map
Loading sold comps map…
Walkable amenities ~0.75 mi
Loading nearby amenities…
Taxation est. · year 1
- Rental income
- $258,000
- − Mortgage interest
- −$156,788
- − Property taxes
- −$26,316
- − Insurance
- −$13,995
- − Repairs & maintenance
- −$20,640
- − Management
- −$20,640
- − Depreciation
- −$81,425
- Taxable loss
- −$61,804
- Est. tax savings @ 24.0%
- +$14,833
- After-tax cash flow
- $2,203/yr
For passive investors: Depreciation is non-cash, so a rental often shows a tax loss while cash-flowing — sheltering income. Rental losses are passive: they offset passive income freely, and up to $25,000/yr can offset ordinary (W-2) income if you actively participate and your MAGI is under $100k (phasing out to $0 by $150k); unused losses carry forward. On sale, claimed depreciation is recaptured at up to 25%, and gains may owe capital-gains tax (a 1031 exchange can defer both). Figures are a year-1 estimate at your 24.0% rate — not tax advice; consult a CPA.
Schools (NCES district)
- District
- Locust Valley Central School District
- NCES district ID
- 3617700
- Math proficiency
- 83% ▼ -5.00%
- Reading proficiency
- 79% ▲ 2.00%
- Median HH income
- $104,480
- Composite
- 73.72/100
- National rank
- #171
- State rank
- #38 of 590 in NY
Livability — Old Brookville
- Score
- 56/100
- State rank
- #1119
- US rank
- #23041
Category grades
Schools grade is shown separately in the Schools card above.
Census & demographics
- Census place
- Old Brookville, NY
- City population
- 11,963
- Population (ZIP)
- 11,963
Population outlook (Nassau County) Hauer SSP2
- Today (2025)
- 1,409,302 people
- By 2030
- 1,431,482 · +1.6%
- By 2040
- 1,471,607 · +4.4%
- By 2050
- 1,502,845 · +6.6%
- By 2075
- 1,575,403 · +11.8%
- By 2100
- 1,554,356 · +10.3%
Race, ethnicity, and origin ACS 2023
- Neighborhood character
- Predominantly White (74%)
- Race & ethnicity
- White 74% Hispanic / Latino 15% Asian 8% Two or more races 5%
- Hispanic origin (detail)
- Puerto Rican 1% Cuban 2% Dominican 2% Salvadoran 2%
- Common ancestry
- Scotch-Irish 6% Romanian 6% Iranian 1%
- Foreign-born
- 17% · Canada, China, Dominican Republic
- Languages at home
- 72% English-only · Other Indo-European 13% Spanish 9% Chinese 3%
Political lean MEDSL · Nassau
- 2024 margin
- Toss-up / Even · D 47.9% · R 52.1%
- 2008→2024 swing
- -12.6pp toward R · 2008: 8.4pp · 2024: -4.2pp
- All cycles
- 2024: R+4.2 2020: D+9.5 2016: D+5.3 2012: D+6.7 2008: D+8.4
Not yet ingested
- Civics
- —
Market trends
- HPI YoY
- ▼ -124.51%
- Current HPI
- 279.7243
- Rent YoY
- —
- Metro
- —
- State GDP YoY
- ▲ 2.60%
- F500 in state
- 92
Industry mix (Fortune 500 HQ in NY)
| Industry | F500 HQs | Revenue |
|---|---|---|
| Financial Services | 10 | $950B |
|
||
| Consumer Goods | 9 | $162B |
|
||
| Insurance | 4 | $225B |
|
||
| Telecommunications | 2 | $144B |
|
||
| Pharmaceuticals | 2 | $112B |
|
||
| Media / Entertainment | 2 | $69B |
|
||
Price history
+33.3% since first listed4 events — show timeline
- 2026-03-25 Pending — OneKey® MLS as Distributed by MLS Grid
- 2025-11-24 Listed $2,799,000 OneKey® MLS as Distributed by MLS Grid
- 2020-07-08 Listing Removed — OneKey® MLS as Distributed by MLS Grid
- 2019-07-13 Listed $2,099,000 OneKey® MLS as Distributed by MLS Grid
Property tax history
+0.5%/yrLatest (2024): $26,316 · +7.5% YoY. Source: county tax records.
Cash-flow waterfall
monthlySold comps — $/sqft
last 12 mo · ≤1 miLoading sold comps…