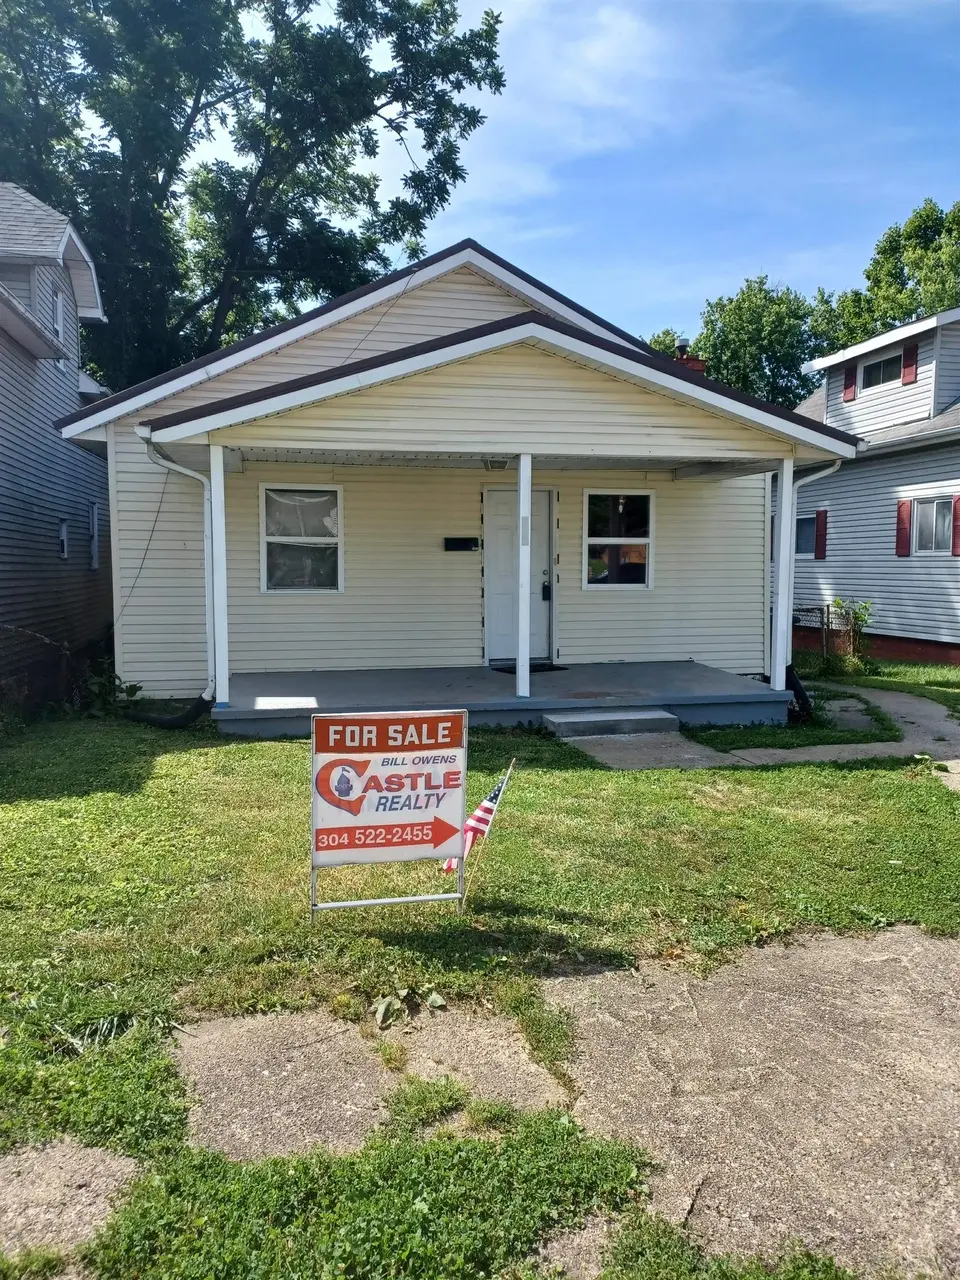
121 Cedar St
Huntington, WV 25705
$79,900B-
3 bd · 1.0 ba ·
1,152 sqft ·
Built 1925
· SingleFamily
· Active
· 20 DOM
Cashflow @ list (25.0% down · 7.5%)
Estimated rent
$925/mo
Mortgage (P&I)
−$419
Tax + insurance
−$124
HOA
−$0
Vac / Maint / Mgmt
−$194
Net cashflow
$188/mo
Annual
$2,256/yr
Cap rate
9.12%
Cash-on-cash
10.08%
DSCR
1.45
1% rule
1.16%
Cash to close
$22,372
Investor read
- This is a 3-bed/1.0-bath single-family listed at $80k.
- At list price, monthly cash flow is $188 ($2k/yr) — positive.
- The deal already cash-flows at list — no discount required.
- Meets the 1% rule at list price ($925 rent vs $80k).
- It's been on market 20 days — a 2% lower offer ($79k) is reasonable based on typical stale-listing flexibility.
- Recommended offer: $79k (1.5% below list) — sets the bar for market timing.
- Local home prices are declining (-3.0%/yr); year-one equity from $552 of loan paydown is wiped out by about $2k of value loss. Plan a longer hold.
- Location reads 79/100 on livability (#16 in WV, #2,045 nationally) — a middle-class / working-renter tenant base. Strengths: amenities A+, commute A+, cost of living A+; Watch: crime F, employment F.
- Cabell County Schools (urban): math 31% / reading 42% proficiency, ranked #13 of 55 in WV (top 24%) — families likely to look elsewhere, expect single-tenant / working-renter base with shorter leases.
- Zoned schools: Huntington East Middle School (math 18% / reading 32%, grade F, #81 of 109 statewide, top 76%, 585 students, 0% FRL); Huntington High School (math 26% / reading 50%, grade F, #31 of 110 statewide, top 28%, 1,704 students, 0% FRL) — zoned schools average 0% FRL vs 47% district-wide (47 pts lower); this property's tenant base skews higher-income than the district average.
- Watch-outs: built in 1925 — expect roof / HVAC / electrical / plumbing capex.
- Market conditions: 163 active listings in the ZIP; 1 comparable units currently listed for rent nearby; 61 units permitted in Cabell County in 2024 (5 in 5+ unit buildings).
- Current owner paid $27k; list at $80k implies a 196% gain — meaningful room to come down on a strong offer.
- Cap rate 9.1% vs local median 6.5% in Huntington — top-decile yield for the area; either an underpriced asset or a hidden risk that comps aren't pricing in. Stress-test before assuming the spread holds.
Questions for listing agent
- Built in 1925 — when were the roof, HVAC, electrical panel, plumbing, and water heater last replaced?
- Is there a deadline driving the sale (1031 exchange, divorce, estate, relocation)? That informs how much negotiation room exists.
- Crime grade is F in this area — have there been break-ins, vandalism, or insurance claims at this property in the last 3 years? What carrier currently insures it and at what premium?
- What's the average days-on-market for RENTAL listings here right now (not sales)? A rising rental-DOM trend means longer vacancies and softer asking-rent achievability than the comps imply.
- What's the recent tenant-quality profile in this submarket — average credit score on applications, eviction rate, late-payment / NSF rate, and stable-employment percentage? A property-management company in the area should have these aggregated.
- How much new for-sale + rental construction is in the pipeline within 1–3 miles? Heavy new supply typically softens prices + rents 12–24 months out; constrained supply supports both.
CashFlowRE · CFR-1FPQBA2NK6FDM2
· Data 1 day ago
cashflowre.app · 2026-05-29