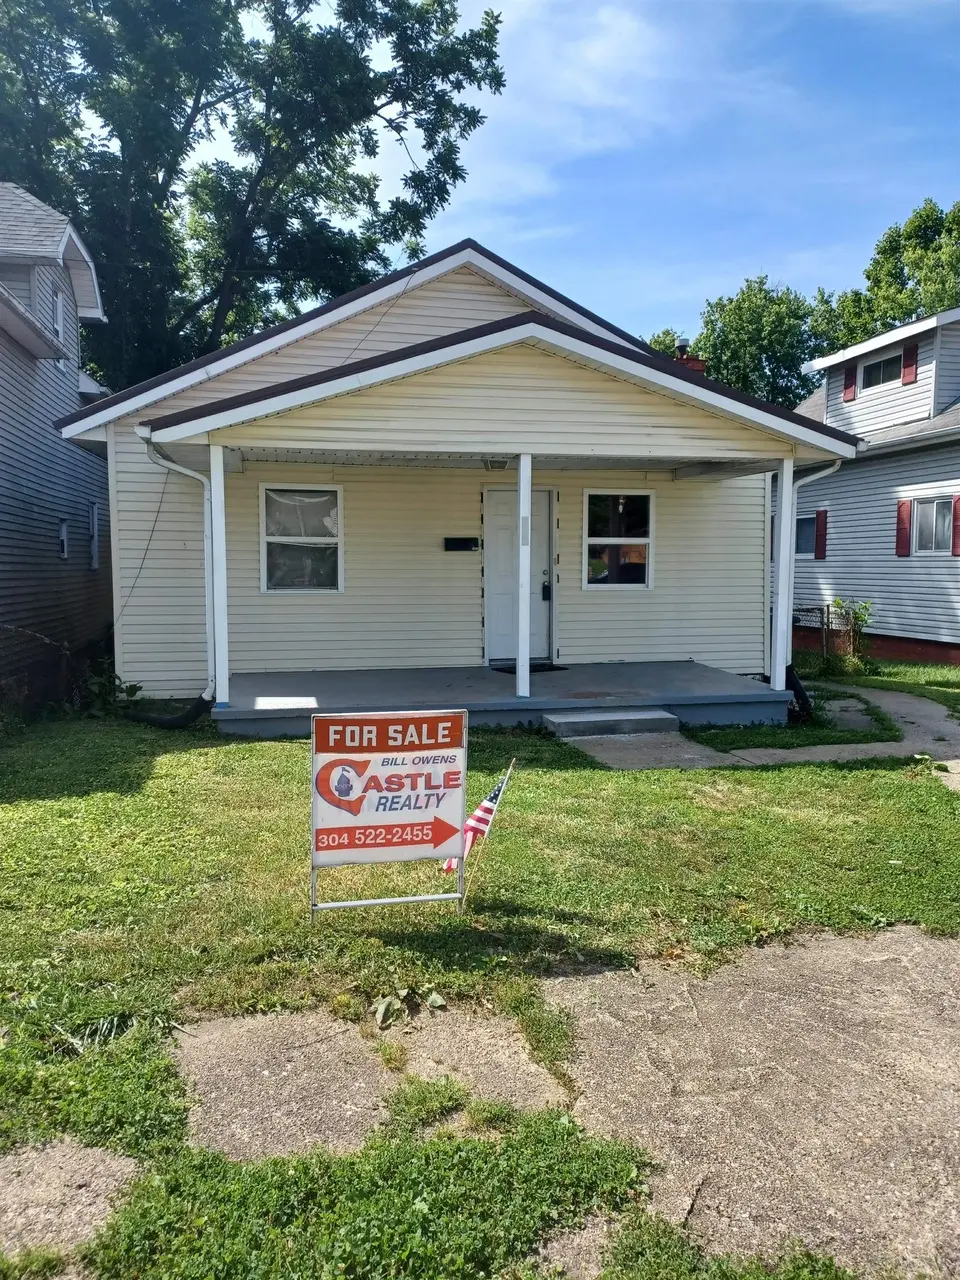
121 Cedar St · Huntington, WV
Flood risk 1/10 · Minimal
- FEMA flood zone
- X (unshaded)
- Chance of flooding over 30 yrs
- 0.0%
- Est. flood insurance / yr
- $473 – $860
Fire risk 3/10 · Minor
- Est. fire insurance / yr
- $787 – $1,461
Heat risk 4/10 · Minor
- Hot days now (above 102°F)
- 7 days/yr
- Hot days in 30 yrs
- 18 days/yr
Wind risk 2/10 · Minimal
- Chance of severe wind over 30 yrs
- 1.0%
Air-quality risk 2/10 · Minimal
- Unhealthy air days now
- 0 days/yr
- Unhealthy air days in 30 yrs
- 1 days/yr
Risk factors via First Street. Map © Google.
Why this score? — see what drove the B- grade
The composite is a weighted blend of 9 inputs, each scored 0–100. Each bar is that input's sub-score; the figure is the points it added to the 100-point composite (weight × sub-score).
- Cash flow +25.6/30.0
- ARV discount +15.0/15.0
- DSCR +8.5/10.0
- 1% rule +6.6/10.0
- Livability +4.0/5.0
- Schools +3.0/10.0
- Rent growth +2.5/5.0
- Condition / age +2.5/5.0
- Appreciation +0.0/10.0
$79,900
🖨 Deal sheet 📄 Offer letter ✓ Due diligence
Listing remarks
Best Value on market today. Easy to care for in and out. 3 Bedrooms, 1.5 Baths, Central heat and cooling. Open floor plan, washer- dryer hook-ups, Furnished kitchen includes deep freezer. Will include a new over range microwave. unfinished basement good for workshop. Fenced back yard. Bus stop at corner, - so is Gino's Pizza. Lots of updating over years. Seller will do NO updates, SELLING 'AS IS'
Key facts
- Furnished kitchen
- Bus stop at corner
- Fenced back yard
Tags
Property features AI
Exterior
- Parking: On-street parking
- Utilities: Public water; Public sewer
- Home design: Single-family residence; One story
- Construction: Vinyl siding; Metal roof
- Exterior features: Deck; Porch; Level to sloped lot
Interior
- Bathrooms: 1 full bathroom; 1 half bathroom
- Heating & cooling: Central heating (natural gas); Central air conditioning
- Interior features: Partial, unfinished basement; Central heating and central air
Neighborhood map
What this means for you Summary
Snapshot
- This is a 3-bed/1.0-bath single-family listed at $80k.
Deal economics
- At list price, monthly cash flow is $188 ($2k/yr) — positive.
- The deal already cash-flows at list — no discount required.
- Meets the 1% rule at list price ($925 rent vs $80k).
- Recommended offer: $79k (1.5% below list) — sets the bar for market timing.
- Cap rate 9.1% vs local median 6.5% in Huntington — top-decile yield for the area; either an underpriced asset or a hidden risk that comps aren't pricing in. Stress-test before assuming the spread holds.
Location & tenants
- Location reads 79/100 on livability (#16 in WV, #2,045 nationally) — a middle-class / working-renter tenant base. Strengths: amenities A+, commute A+, cost of living A+; Watch: crime F, employment F.
- Cabell County Schools (urban): math 31% / reading 42% proficiency, ranked #13 of 55 in WV (top 24%) — families likely to look elsewhere, expect single-tenant / working-renter base with shorter leases.
- Zoned schools: Huntington East Middle School (math 18% / reading 32%, grade F, #81 of 109 statewide, top 76%, 585 students, 0% FRL); Huntington High School (math 26% / reading 50%, grade F, #31 of 110 statewide, top 28%, 1,704 students, 0% FRL) — zoned schools average 0% FRL vs 47% district-wide (47 pts lower); this property's tenant base skews higher-income than the district average.
- Market conditions: 163 active listings in the ZIP; 1 comparable units currently listed for rent nearby; 61 units permitted in Cabell County in 2024 (5 in 5+ unit buildings).
Forward outlook
- Local home prices are declining (-3.0%/yr); year-one equity from $552 of loan paydown is wiped out by about $2k of value loss. Plan a longer hold.
Negotiation context
- It's been on market 20 days — a 2% lower offer ($79k) is reasonable based on typical stale-listing flexibility.
- Current owner paid $27k; list at $80k implies a 196% gain — meaningful room to come down on a strong offer.
Risks & watch-outs
- Watch-outs: built in 1925 — expect roof / HVAC / electrical / plumbing capex.
Questions for the listing agent
- Built in 1925 — when were the roof, HVAC, electrical panel, plumbing, and water heater last replaced?
- Is there a deadline driving the sale (1031 exchange, divorce, estate, relocation)? That informs how much negotiation room exists.
- Crime grade is F in this area — have there been break-ins, vandalism, or insurance claims at this property in the last 3 years? What carrier currently insures it and at what premium?
- What's the average days-on-market for RENTAL listings here right now (not sales)? A rising rental-DOM trend means longer vacancies and softer asking-rent achievability than the comps imply.
- What's the recent tenant-quality profile in this submarket — average credit score on applications, eviction rate, late-payment / NSF rate, and stable-employment percentage? A property-management company in the area should have these aggregated.
- How much new for-sale + rental construction is in the pipeline within 1–3 miles? Heavy new supply typically softens prices + rents 12–24 months out; constrained supply supports both.
Investment metrics
- 1% rule
- 1.16% ✓
- Cap rate
- 9.12%
- Cash-on-cash
- 10.08%
- DSCR
- 1.45
- GRM
- 7.2
CMA / ARV
- ARV (on-the-fly)
- $127,872
- Comps found
- 12
Show comp detail 12 sales within ~0.75 mi
| Address | Dist | Beds/Ba | Sqft | Sold | Price | $/sf | Match |
|---|---|---|---|---|---|---|---|
| 916 23rd St | 0.53mi | 3/2.0 | 1,143 (-1%) | 0mo | $106,900 | $94 | 70 |
| 306 Davis St | 0.21mi | 3/1.5 | 1,232 (+7%) | 11mo | $71,900 | $58 | 68 |
| 2733 Washington Blvd | 0.66mi | 3/2.0 | 1,176 (+2%) | 10mo | $177,900 | $151 | 53 |
| 200 S Walnut St | 0.43mi | 3/2.0 | 1,253 (+9%) | 11mo | $166,500 | $133 | 52 |
| 129 North Ter | 0.49mi | 3/1.5 | 1,304 (+13%) | 1mo | $140,500 | $108 | 52 |
| 2248 Cherry Ave | 0.56mi | 3/1.0 | 1,272 (+10%) | 10mo | $220,000 | $173 | 48 |
| 2204 9th Ave | 0.62mi | 2/1.0 (-1) | 1,218 (+6%) | 11mo | $101,000 | $83 | 47 |
| 280 S Walnut St | 0.58mi | 2/1.5 (-1) | 1,043 (-10%) | 7mo | $82,500 | $79 | 44 |
| 2923 Moreland Ave | 0.66mi | 4/2.0 (+1) | 1,040 (-10%) | 0mo | $119,000 | $114 | 44 |
| 117 Morris St | 0.56mi | 2/1.0 (-1) | 1,008 (-12%) | 6mo | $50,000 | $50 | 44 |
| 2856 Overlook Dr | 0.59mi | 3/2.0 | 1,276 (+11%) | 8mo | $141,500 | $111 | 44 |
| 2953 Jarrell St | 0.75mi | 4/1.5 (+1) | 1,074 (-7%) | 11mo | $140,000 | $130 | 38 |
Match score weights: distance 35% · size 25% · config 20% · recency 20%. Top-matched comps best support the ARV.
Projected returns pro-forma
-3.0% appreciation · 3.0% rent growth · sell at horizon
- IRR
- -1.1%
- Equity multiple
- 0.96×
- Total profit
- $-967
- Equity at exit
- $11,913
- IRR
- 8.5%
- Equity multiple
- 1.65×
- Total profit
- $14,608
- Equity at exit
- $6,908
Cash invested: $22,372 (down + closing). Projections, not guarantees.
Landlord ↔ Tenant lean methodology
- Overall (STATE)
- 83 Strongly Landlord-Friendly
- State West Virginia
- 83 Strongly Landlord-Friendly · R+22
- County
- — inherits STATE
- City
- — inherits STATE
ZIP-level market 25705
- Home prices YoY
- -24.9%
- Active inventory
- 163
- Price-to-rent
- 7.2×
Monthly cashflow live
- Estimated rent
- $925 medium interval (Pro) →
- Mortgage (P&I)
- −$419
- Tax from tax record
- −$90 /mo · $1,086/yr
- Insurance
- −$33
- HOA
- −$0
- Vacancy / Maint / Mgmt
- −$194
- Net cashflow
- $188
Break-even live
UW: 25.0% down · 7.5% · 30yr · 1.5% tax · 5.0% vac · 8.0% maint · 8.0% mgmt
Financing live
Cash to close
- Down payment
- $19,975
- Closing costs
- $2,397
- Reserves months
- —
- Total cash needed
- —
Loan-product check · same deal, 3 products live
Conventional
25% down · 7.5% · 30yr
- Down + closing
- —
- Monthly P&I
- —
- Monthly cashflow
- —
- DSCR
- —
- Eligible?
- —
Personal DTI + credit; lowest rate.
DSCR
20% down · 8.5% · 30yr
- Down + closing
- —
- Monthly P&I
- —
- Monthly cashflow
- —
- DSCR
- —
- Eligible?
- —
No personal income docs; deal must DSCR.
Hard money
10% down · 12.0% · 12mo
- Down + closing
- —
- Monthly P&I
- —
- Monthly cashflow
- —
- DSCR
- —
- Eligible?
- —
Short-term bridge; refi at stabilization.
Rent comps 1 comps
| Address | Beds | Baths | Sqft | Rent | $/sqft | DOM | Units | Dist |
|---|---|---|---|---|---|---|---|---|
| 1739 6th Ave Huntington, WV | 1.0–2.0 | 1.0 | 825 | $925 | $1.12 | 43d | 1 | 1.10mi |
Listing history 17 events
-
2026-06-19days on market $79,900 Active 20 DOM
-
2026-06-18remarks 401-char remark
-
2026-06-18days on market $79,900 Active 19 DOM
-
2026-06-17days on market $79,900 Active 18 DOM
-
2026-06-16days on market $79,900 Active 17 DOM
-
2026-06-15days on market $79,900 Active 16 DOM
-
2026-06-14days on market $79,900 Active 14 DOM
-
2026-06-12days on market $79,900 Active 13 DOM
-
2026-06-09days on market $79,900 Active 10 DOM
-
2026-06-08days on market $79,900 Active 9 DOM
-
2026-06-07days on market $79,900 Active 8 DOM
-
2026-06-05days on market $79,900 Active 5 DOM
-
2026-06-03days on market $79,900 Active 4 DOM
-
2026-06-02days on market $79,900 Active 3 DOM
-
2026-06-01days on market $79,900 Active 2 DOM
-
2026-05-31remarks 357-char remark
-
2026-05-31$79,900 Active 1 DOM
ⓘ Source: listings_history table (triggers on properties + properties_extension) + one-shot
backfill from property_details.listing_events for pre-trigger history.
Tax reassessment forecast WV · Resets to sale price
- Current annual tax
- $1,086 · $90/mo
- Projected year-2 tax
- $1,086 · $90/mo
- Expected delta
- $0/yr ($0/mo · 0.0%)
ⓘ Screening estimate from a state-policy table — verify with the county assessor before closing.
Climate risk First Street
- Flood 1/10 Low FEMA zone X (unshaded) · 0% chance over 30 yrs
- Wildfire 3/10 Moderate
- Heat 4/10 Moderate 7 d/yr ≥102°F today · 18 d/yr by 30 yrs out
- Wind 2/10 Low 100% chance of damaging wind over 30 yrs
- Air quality 2/10 Low 0 unhealthy d/yr today · 1 by 30 yrs out
Nearby sold comps map
Loading sold comps map…
Walkable amenities ~0.75 mi
Loading nearby amenities…
Taxation est. · year 1
- Rental income
- $11,100
- − Mortgage interest
- −$4,476
- − Property taxes
- −$1,086
- − Insurance
- −$400
- − Repairs & maintenance
- −$888
- − Management
- −$888
- − Depreciation
- −$2,324
- Taxable income
- $1,039
- Est. tax owed @ 24.0%
- −$249
- After-tax cash flow
- $2,006/yr
For passive investors: Depreciation is non-cash, so a rental often shows a tax loss while cash-flowing — sheltering income. Rental losses are passive: they offset passive income freely, and up to $25,000/yr can offset ordinary (W-2) income if you actively participate and your MAGI is under $100k (phasing out to $0 by $150k); unused losses carry forward. On sale, claimed depreciation is recaptured at up to 25%, and gains may owe capital-gains tax (a 1031 exchange can defer both). Figures are a year-1 estimate at your 24.0% rate — not tax advice; consult a CPA.
Schools (NCES district)
- District
- Cabell County Schools
- NCES district ID
- 5400180
- Math proficiency
- 31% ▼ -7.00%
- Reading proficiency
- 42% ▼ -6.00%
- Median HH income
- $36,426
- Composite
- 30.26/100
- National rank
- #6285
- State rank
- #13 of 55 in WV
Livability — Huntington
- Score
- 79/100
- State rank
- #16
- US rank
- #2045
Category grades
Schools grade is shown separately in the Schools card above.
Census & demographics
- Census place
- Huntington, WV
- City population
- 25,795
- Population (ZIP)
- 20,668
Population outlook (Cabell County) Hauer SSP2
- Today (2025)
- 97,574 people
- By 2030
- 98,060 · +0.5%
- By 2040
- 98,817 · +1.3%
- By 2050
- 100,185 · +2.7%
- By 2075
- 105,895 · +8.5%
- By 2100
- 105,948 · +8.6%
Race, ethnicity, and origin ACS 2023
- Neighborhood character
- Predominantly White (89%)
- Race & ethnicity
- White 89% Black 5% Two or more races 4% Hispanic / Latino 2% Asian 1%
- Common ancestry
- Slovak 3% Serbian 2% Lithuanian 2%
- Foreign-born
- 2%
- Languages at home
- 97% English-only · Spanish 1%
Political lean MEDSL · Cabell
- 2024 margin
- Strong R (+21.9) · D 38.0% · R 59.9% · Other 2.0%
- 2008→2024 swing
- -11.8pp toward R · 2008: -10.1pp · 2024: -21.9pp
- All cycles
- 2024: R+21.9 2020: R+18.0 2016: R+25.5 2012: R+13.9 2008: R+10.1
Not yet ingested
- Civics
- —
Market trends
- HPI YoY
- ▼ -57.08%
- Current HPI
- 171.7797
- Rent YoY
- —
- Metro
- —
- State GDP YoY
- —
- F500 in state
- 0
Price history
+195.9% since first listed2 events — show timeline
- 2026-05-30 Listed $79,900 HBRMLS
- 2007-11-28 Sold (Public Records) $27,000 Public Records
Property tax history
+2.1%/yrLatest (2025): $1,086 · +8.4% YoY. Source: county tax records.
Cash-flow waterfall
monthlySold comps — $/sqft
last 12 mo · ≤1 miLoading sold comps…