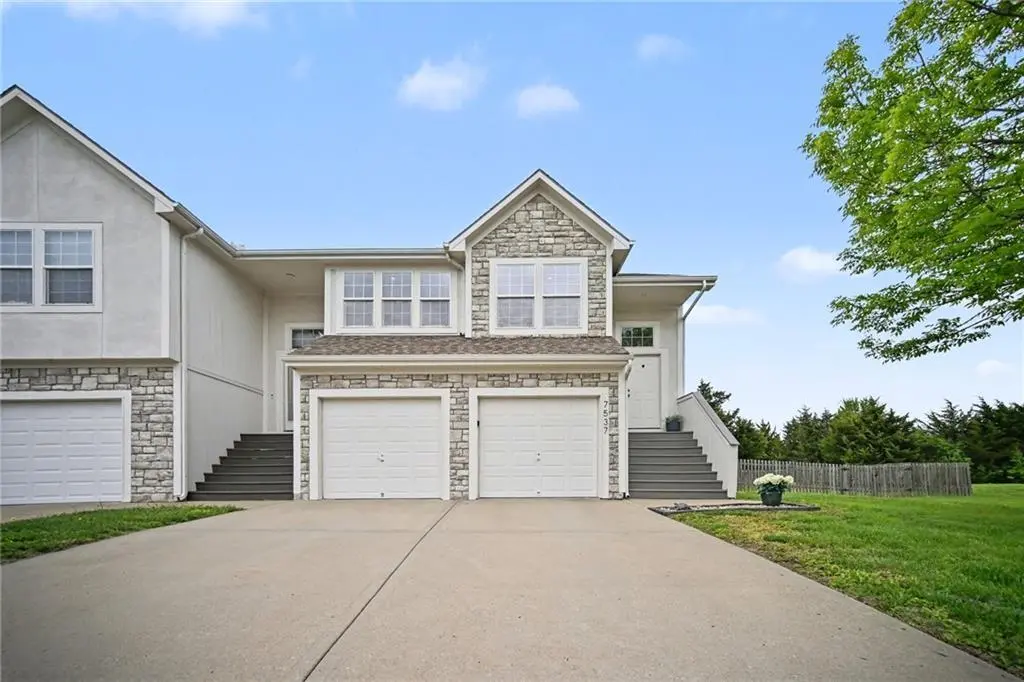
7537 Mccoy St
Shawnee, KS 66227
$345,000D-
3 bd · 2.0 ba ·
1,855 sqft ·
Built 2004
· MultiFamily
· Pending
· 4 DOM
Cashflow @ list (25.0% down · 7.5%)
Estimated rent
$2,726/mo
Mortgage (P&I)
−$1,809
Tax + insurance
−$491
HOA
−$13
Vac / Maint / Mgmt
−$572
Net cashflow
$-160/mo
Annual
$-1,915/yr
Cap rate
5.74%
Cash-on-cash
-1.98%
DSCR
0.91
1% rule
0.79%
Cash to close
$96,600
Investor read
- This is a 3-bed/2.0-bath multifamily listed at $345k.
- At list price, monthly cash flow is $-160 ($-2k/yr) — negative.
- To cash-flow at today's rent, offer at most $317k (8.2% below list).
- To meet the 1% rule (rent ≥ 1% of price), the offer needs to be $273k (21.0% below list).
- Only 4 days on market — expect competitive offers; lowballing is unlikely to land.
- Recommended offer: $273k (21.0% below list) — sets the bar for 1% rule.
- Local home prices are declining (-3.0%/yr); year-one equity from $2k of loan paydown is wiped out by about $10k of value loss. Plan a longer hold.
- Location reads 87/100 on livability (#2 in KS, #276 nationally) — a professional / high-income tenant draw. Strengths: commute A+, employment A+, housing A+.
- De Soto (suburban): math 49% / reading 53% proficiency, ranked #3 of 169 in KS (top 2%) — acceptable for families but not a draw, mixed tenant base, ~2y average lease; only 10% free/reduced lunch — higher-income household profile.
- Zoned schools: Clear Creek Elem (math 54% / reading 66%, grade B-, #69 of 684 statewide, top 10%, 537 students, 10% FRL); Mill Valley High School (math 41% / reading 40%, grade F, #19 of 327 statewide, top 6%, 1,355 students, 7% FRL) — zoned schools at 9% FRL track the district average.
- Market conditions: 103 active listings in the ZIP; 2 comparable units currently listed for rent nearby; high-income renter base; 2,969 units permitted in Johnson County in 2024 (1,066 in 5+ unit buildings).
- Johnson County population projected at +27% by 2050 — long-run rental-demand tailwind backs the buy-and-hold thesis.
- 2 sale attempts since 21y ago with the ask held roughly flat each time — persistent listings suggest the price (not the market) is what's stuck; bring a comps-based counter.
- Cap rate 5.7% vs local median 3.2% in Shawnee — top-decile yield for the area; either an underpriced asset or a hidden risk that comps aren't pricing in. Stress-test before assuming the spread holds.
Questions for listing agent
- What do current leases actually rent for vs. the listed asking? Can we see a recent rent roll and the last 12 months of T-12 income?
- What does the HOA fee cover, when was the last increase, and are there any pending special assessments or reserve-fund shortfalls?
- Is there a deadline driving the sale (1031 exchange, divorce, estate, relocation)? That informs how much negotiation room exists.
- Schools are B-rated — typically a magnet for longer-tenancy family renters. What's the average tenant stay here, and is there a school-zone premium baked into asking?
- The area grade is low — what's the realistic commute time and amenity access for the typical tenant pool here? Any planned neighborhood developments (good or bad) we should know about?
- What's the average days-on-market for RENTAL listings here right now (not sales)? A rising rental-DOM trend means longer vacancies and softer asking-rent achievability than the comps imply.
- What's the recent tenant-quality profile in this submarket — average credit score on applications, eviction rate, late-payment / NSF rate, and stable-employment percentage? A property-management company in the area should have these aggregated.
- How much new apartment / multifamily construction is in the pipeline within 1–3 miles? Heavy new supply (>2% of stock underway) typically softens rents 12–24 months out; light construction supports rent growth.
CashFlowRE · CFR-1G2KBHDB3E5840
· Data 1 week ago
cashflowre.app · 2026-05-29