 Multi-family
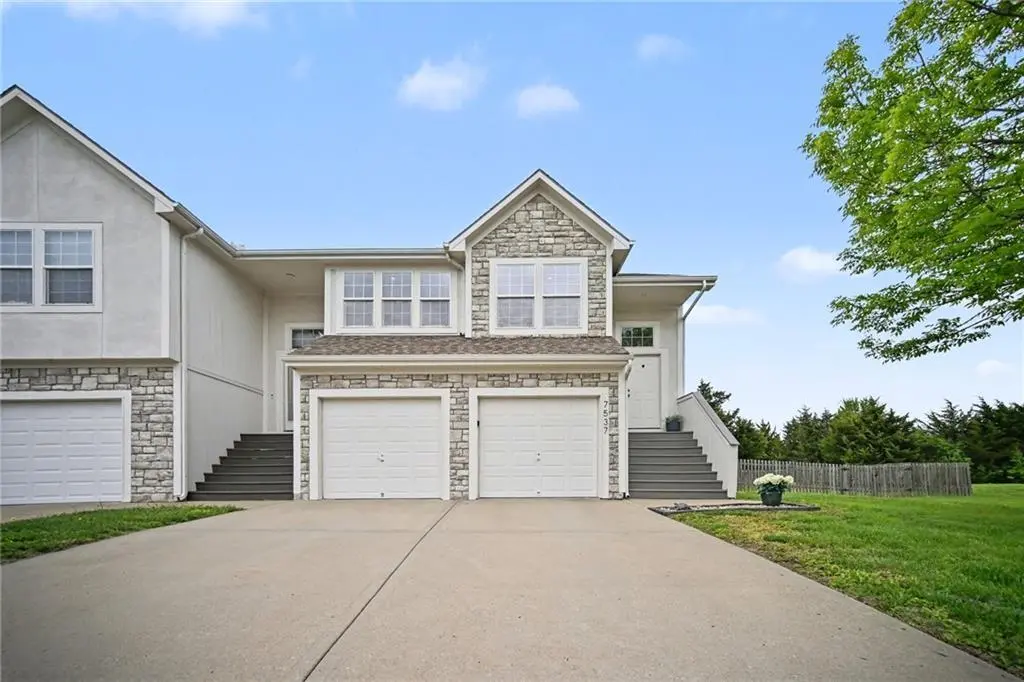
7537 Mccoy St · Shawnee, KS
Flood risk 1/10 · Minimal
- FEMA flood zone
- X (unshaded)
- Chance of flooding over 30 yrs
- 0.0%
- Est. flood insurance / yr
- $473 – $860
Fire risk 3/10 · Minor
- Est. fire insurance / yr
- $1,154 – $2,142
Heat risk 4/10 · Minor
- Hot days now (above 107°F)
- 7 days/yr
- Hot days in 30 yrs
- 17 days/yr
Wind risk 2/10 · Minimal
- Chance of severe wind over 30 yrs
- —
Air-quality risk 2/10 · Minimal
- Unhealthy air days now
- 2 days/yr
- Unhealthy air days in 30 yrs
- 2 days/yr
Risk factors via First Street. Map © Google.
Why this score? — see what drove the D- grade
The composite is a weighted blend of 9 inputs, each scored 0–100. Each bar is that input's sub-score; the figure is the points it added to the 100-point composite (weight × sub-score).
- Cash flow +10.8/30.0
- ARV discount +7.5/15.0
- Schools +4.8/10.0
- Livability +4.4/5.0
- DSCR +3.1/10.0
- 1% rule +2.9/10.0
- Rent growth +2.5/5.0
- Condition / age +2.5/5.0
- Appreciation +0.0/10.0
$345,000
🖨 Deal sheet 📄 Offer letter ✓ Due diligence
Multi-family units
County records classify this as Multi-Family (2-4 Unit). Listing-text estimate: 1 unit. estimate disagrees with records
Listing remarks MLS
The Ellington 2 car garage, Nice Kitchen and dining area. Large lot, you own the land! Fencing allowed. Great master! Lower level has door out to nice back yard with trees!Green space across the street!!
Key facts
- Updated interior
- Largest lots
- $13 HOA
Tags
Property features AI
Finance
- Other: Living area reported as 1,855 (above and below grade finished areas recorded separately); Age: 21–30 years
- HOA & community: Homeowners association with an annual fee of $150 (covers other items)
Exterior
- Parking: Attached garage facing front; 2-car garage; Off-street parking
- Security: Smoke detector(s)
- Utilities: Public water; Public sewer; Cable, fiber, and high-speed internet available
- Home design: Attached townhouse; Composition roof; Stone trim and stucco exterior
- Construction: Stone trim and stucco construction; Composition roof; Finished basement with concrete floor and garage entrance
- Exterior features: Patio; Wood privacy fencing; City lot; Paved road with public maintenance; Not in a flood plain
Interior
- Kitchen: Dishwasher; Disposal; Microwave; Refrigerator; Electric range; Breakfast area
- Bedrooms: 3 bedrooms (upper and lower levels)
- Flooring: Carpet; Vinyl; Vinyl in kitchen and bathrooms
- Bathrooms: 2 full bathrooms
- Heating & cooling: Forced air heating; Electric cooling
- Interior features: Ceiling fans; Smart thermostat; Walk-in closets; Split entry floor plan; Smoke detector(s)
- Laundry & utility: Laundry room on lower level
Neighborhood map
What this means for you Summary
Snapshot
- This is a 3-bed/2.0-bath multifamily listed at $345k.
Deal economics
- At list price, monthly cash flow is $-160 ($-2k/yr) — negative.
- To cash-flow at today's rent, offer at most $317k (8.2% below list).
- To meet the 1% rule (rent ≥ 1% of price), the offer needs to be $273k (21.0% below list).
- Recommended offer: $273k (21.0% below list) — sets the bar for 1% rule.
- Cap rate 5.7% vs local median 3.2% in Shawnee — top-decile yield for the area; either an underpriced asset or a hidden risk that comps aren't pricing in. Stress-test before assuming the spread holds.
Location & tenants
- Location reads 87/100 on livability (#2 in KS, #276 nationally) — a professional / high-income tenant draw. Strengths: commute A+, employment A+, housing A+.
- De Soto (suburban): math 49% / reading 53% proficiency, ranked #3 of 169 in KS (top 2%) — acceptable for families but not a draw, mixed tenant base, ~2y average lease; only 10% free/reduced lunch — higher-income household profile.
- Zoned schools: Clear Creek Elem (math 54% / reading 66%, grade B-, #69 of 684 statewide, top 10%, 537 students, 10% FRL); Mill Valley High School (math 41% / reading 40%, grade F, #19 of 327 statewide, top 6%, 1,355 students, 7% FRL) — zoned schools at 9% FRL track the district average.
- Market conditions: 103 active listings in the ZIP; 2 comparable units currently listed for rent nearby; high-income renter base; 2,969 units permitted in Johnson County in 2024 (1,066 in 5+ unit buildings).
Forward outlook
- Local home prices are declining (-3.0%/yr); year-one equity from $2k of loan paydown is wiped out by about $10k of value loss. Plan a longer hold.
- Johnson County population projected at +27% by 2050 — long-run rental-demand tailwind backs the buy-and-hold thesis.
Negotiation context
- Only 4 days on market — expect competitive offers; lowballing is unlikely to land.
- 2 sale attempts since 21y ago with the ask held roughly flat each time — persistent listings suggest the price (not the market) is what's stuck; bring a comps-based counter.
Questions for the listing agent
- What do current leases actually rent for vs. the listed asking? Can we see a recent rent roll and the last 12 months of T-12 income?
- What does the HOA fee cover, when was the last increase, and are there any pending special assessments or reserve-fund shortfalls?
- Is there a deadline driving the sale (1031 exchange, divorce, estate, relocation)? That informs how much negotiation room exists.
- Schools are B-rated — typically a magnet for longer-tenancy family renters. What's the average tenant stay here, and is there a school-zone premium baked into asking?
- The area grade is low — what's the realistic commute time and amenity access for the typical tenant pool here? Any planned neighborhood developments (good or bad) we should know about?
- What's the average days-on-market for RENTAL listings here right now (not sales)? A rising rental-DOM trend means longer vacancies and softer asking-rent achievability than the comps imply.
- What's the recent tenant-quality profile in this submarket — average credit score on applications, eviction rate, late-payment / NSF rate, and stable-employment percentage? A property-management company in the area should have these aggregated.
- How much new apartment / multifamily construction is in the pipeline within 1–3 miles? Heavy new supply (>2% of stock underway) typically softens rents 12–24 months out; light construction supports rent growth.
Investment metrics
- 1% rule
- 0.79% ✗
- Cap rate
- 5.74%
- Cash-on-cash
- -1.98%
- DSCR
- 0.91
- GRM
- 10.5
CMA / ARV
No comps found within radius.
Projected returns pro-forma
-3.0% appreciation · 3.0% rent growth · sell at horizon
- IRR
- -19.6%
- Equity multiple
- 0.32×
- Total profit
- $-66,071
- Equity at exit
- $51,441
- IRR
- -12.4%
- Equity multiple
- 0.27×
- Total profit
- $-70,631
- Equity at exit
- $29,829
Cash invested: $96,600 (down + closing). Projections, not guarantees.
Landlord ↔ Tenant lean methodology
- Overall (STATE)
- 83 Strongly Landlord-Friendly
- State Kansas
- 83 Strongly Landlord-Friendly · R+10
- County
- — inherits STATE
- City
- — inherits STATE
ZIP-level market 66227
- Home prices YoY
- -25.7%
- Active inventory
- 103
- Price-to-rent
- 10.5×
Monthly cashflow live
- Estimated rent
- $2,726 medium interval (Pro) →
- Mortgage (P&I)
- −$1,809
- Tax from tax record
- −$347 /mo · $4,165/yr
- Insurance
- −$144
- HOA
- −$13
- Vacancy / Maint / Mgmt
- −$572
- Net cashflow
- $-160
Break-even live
UW: 25.0% down · 7.5% · 30yr · 1.5% tax · 5.0% vac · 8.0% maint · 8.0% mgmt
Financing live
Cash to close
- Down payment
- $86,250
- Closing costs
- $10,350
- Reserves months
- —
- Total cash needed
- —
Loan-product check · same deal, 3 products live
Conventional
25% down · 7.5% · 30yr
- Down + closing
- —
- Monthly P&I
- —
- Monthly cashflow
- —
- DSCR
- —
- Eligible?
- —
Personal DTI + credit; lowest rate.
DSCR
20% down · 8.5% · 30yr
- Down + closing
- —
- Monthly P&I
- —
- Monthly cashflow
- —
- DSCR
- —
- Eligible?
- —
No personal income docs; deal must DSCR.
Hard money
10% down · 12.0% · 12mo
- Down + closing
- —
- Monthly P&I
- —
- Monthly cashflow
- —
- DSCR
- —
- Eligible?
- —
Short-term bridge; refi at stabilization.
Rent comps 2 comps
| Address | Beds | Baths | Sqft | Rent | $/sqft | DOM | Units | Dist |
|---|---|---|---|---|---|---|---|---|
| 22907 W 72nd Ter Shawnee, KS | 4.0 | 4.0 | 2200 | $2,695 | $1.23 | 23d | 1 | 0.49mi |
| 6522 Noble St Shawnee, KS | 3.0–4.0 | 2.5 | 1689 | $2,200 | $1.30 | 1d | 1 | 1.44mi |
HOA detail
- Monthly dues
- $13 · $156/yr
Listing history 6 events
-
2026-05-05status Pending
-
2026-04-30$345,000 Active
-
2024-06-04soldstatus
-
2020-08-12soldstatus
-
2005-12-22soldstatus 203-char remark
Show marketing remark (203 chars)
The Ellington 2 car garage, Nice Kitchen and dining area. Large lot, you own the land! Fencing allowed. Great master! Lower level has door out to nice back yard with trees!Green space across the street!!
-
2005-07-31$155,500 203-char remark
Show marketing remark (203 chars)
The Ellington 2 car garage, Nice Kitchen and dining area. Large lot, you own the land! Fencing allowed. Great master! Lower level has door out to nice back yard with trees!Green space across the street!!
ⓘ Source: listings_history table (triggers on properties + properties_extension) + one-shot
backfill from property_details.listing_events for pre-trigger history.
Tax reassessment forecast KS · Resets to sale price
- Current annual tax
- $4,165 · $347/mo
- Projected year-2 tax
- $4,864 · $405/mo
- Expected delta
- +$699/yr (+$58/mo · 16.8%)
ⓘ Screening estimate from a state-policy table — verify with the county assessor before closing.
Climate risk First Street
- Flood 1/10 Low FEMA zone X (unshaded) · 0% chance over 30 yrs
- Wildfire 3/10 Moderate
- Heat 4/10 Moderate 7 d/yr ≥107°F today · 17 d/yr by 30 yrs out
- Wind 2/10 Low
- Air quality 2/10 Low 2 unhealthy d/yr today · 2 by 30 yrs out
Nearby sold comps map
Loading sold comps map…
Walkable amenities ~0.75 mi
Loading nearby amenities…
Taxation est. · year 1
- Rental income
- $32,711
- − Mortgage interest
- −$19,325
- − Property taxes
- −$4,165
- − Insurance
- −$1,725
- − Repairs & maintenance
- −$2,617
- − Management
- −$2,617
- − HOA
- −$156
- − Depreciation
- −$10,036
- Taxable loss
- −$7,931
- Est. tax savings @ 24.0%
- +$1,903
- After-tax cash flow
- $-12/yr
For passive investors: Depreciation is non-cash, so a rental often shows a tax loss while cash-flowing — sheltering income. Rental losses are passive: they offset passive income freely, and up to $25,000/yr can offset ordinary (W-2) income if you actively participate and your MAGI is under $100k (phasing out to $0 by $150k); unused losses carry forward. On sale, claimed depreciation is recaptured at up to 25%, and gains may owe capital-gains tax (a 1031 exchange can defer both). Figures are a year-1 estimate at your 24.0% rate — not tax advice; consult a CPA.
Schools (NCES district)
- District
- De Soto
- NCES district ID
- 2005490
- Math proficiency
- 49% ▼ -1.00%
- Reading proficiency
- 53% ▼ -1.00%
- Median HH income
- $96,361
- Composite
- 48.04/100
- National rank
- #2192
- State rank
- #3 of 169 in KS
Livability — Shawnee
- Score
- 87/100
- State rank
- #2
- US rank
- #276
Category grades
Schools grade is shown separately in the Schools card above.
Census & demographics
- Census place
- Shawnee, KS
- County
- Johnson County · 574,662 people
- City population
- 60,541
- Metro
- Kansas City, MO-KS
- Population (ZIP)
- 9,595
- Household income
- $139,883
- Rent vs Own
- Severe rent burden
- 14.0
Population outlook (Johnson County) Hauer SSP2
- Today (2025)
- 663,396 people
- By 2030
- 702,585 · +5.9%
- By 2040
- 775,386 · +16.9%
- By 2050
- 841,772 · +26.9%
- By 2075
- 994,137 · +49.9%
- By 2100
- 1,073,036 · +61.7%
Race, ethnicity, and origin ACS 2023
- Neighborhood character
- Predominantly White (85%)
- Race & ethnicity
- White 85% Two or more races 6% Black 5% Hispanic / Latino 4% Asian 2%
- Common ancestry
- Romanian 4% English 4% Italian 3%
- Foreign-born
- 4% · Canada, China
- Languages at home
- 94% English-only · Spanish 4% German/W. Germanic 1% Tagalog/Filipino 1%
Political lean MEDSL · Johnson
- 2024 margin
- Lean D (+8.5) · D 53.4% · R 44.9% · Other 1.8%
- 2008→2024 swing
- +17.5pp toward D · 2008: -9.0pp · 2024: 8.5pp
- All cycles
- 2024: D+8.5 2020: D+8.2 2016: R+2.7 2012: R+17.8 2008: R+9.0
Not yet ingested
- Civics
- —
Market trends
- HPI YoY
- ▼ -87.02%
- Current HPI
- 251.8801
- Rent YoY
- —
- Metro
- Kansas City, MO-KS
- State GDP YoY
- —
- F500 in state
- 0
Price history
+121.9% since first listed6 events — show timeline
- 2026-05-05 Pending — Heartland MLS as Distributed by MLS Grid
- 2026-04-30 Listed $345,000 Heartland MLS as Distributed by MLS Grid
- 2024-06-04 Sold (Public Records) — Public Records
- 2020-08-12 Sold (Public Records) — Public Records
- 2005-12-22 Sold (MLS) — Heartland MLS as Distributed by MLS Grid
- 2005-07-31 Listed $155,500 Heartland MLS as Distributed by MLS Grid
Property tax history
+5.3%/yrLatest (2025): $4,165 · +27.0% YoY. Source: county tax records.
Cash-flow waterfall
monthlySold comps — $/sqft
last 12 mo · ≤1 miLoading sold comps…