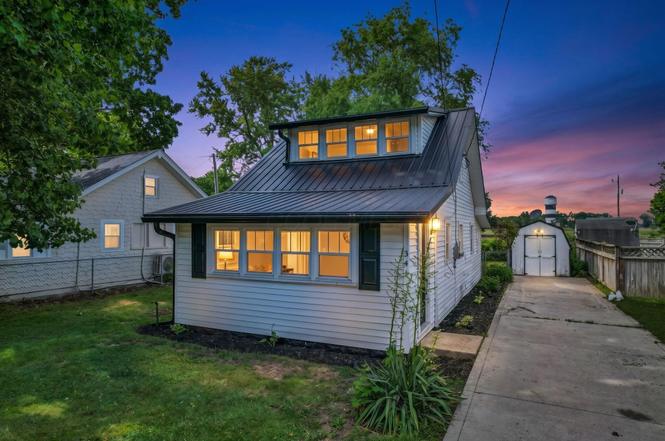
341 Highland Ave
Buckeye Lake, OH 43008
$229,900D+
2 bd · 1.0 ba ·
891 sqft ·
Built 1930
· SingleFamily
· Active
· 7 DOM
Cashflow @ list (25.0% down · 7.5%)
Estimated rent
$2,088/mo
Mortgage (P&I)
−$1,206
Tax + insurance
−$285
HOA
−$0
Vac / Maint / Mgmt
−$439
Net cashflow
$159/mo
Annual
$1,913/yr
Cap rate
7.13%
Cash-on-cash
2.97%
DSCR
1.13
1% rule
0.91%
Cash to close
$64,372
Investor read
- This is a 2-bed/1.0-bath single-family listed at $230k.
- At list price, monthly cash flow is $159 ($2k/yr) — positive.
- The deal already cash-flows at list — no discount required.
- To meet the 1% rule (rent ≥ 1% of price), the offer needs to be $209k (9.2% below list).
- Only 7 days on market — expect competitive offers; lowballing is unlikely to land.
- Recommended offer: $209k (9.2% below list) — sets the bar for 1% rule.
- In year one you build about $11k of equity ($2k loan paydown + $9k appreciation (4.1% local appreciation)).
- Location reads 66/100 on livability (#671 in OH) — a middle-class / working-renter tenant base. Strengths: crime A+, cost of living A+, housing A+; Watch: employment C-, schools F, amenities F.
- Lakewood Local (rural): math 44% / reading 49% proficiency, ranked #481 of 656 in OH (top 73%) — families likely to look elsewhere, expect single-tenant / working-renter base with shorter leases.
- Watch-outs: built in 1930 — expect roof / HVAC / electrical / plumbing capex.
- Market conditions: 31 active listings in the ZIP; 2 comparable units currently listed for rent nearby; solid renter incomes; 159 units permitted in Licking County in 2024 (0 in 5+ unit buildings).
- 2 sale attempts since 21y ago with the ask held roughly flat each time — persistent listings suggest the price (not the market) is what's stuck; bring a comps-based counter.
- Current owner paid $40k; list at $230k implies a 476% gain — meaningful room to come down on a strong offer.
- At projected returns (4.1% appreciation + 3.0% rent growth), your $64k cash investment doubles in ~5 years — after that, you're playing with house money.
- By year 4, paydown + projected appreciation supports a ~$37k cash-out refi (75% LTV) — recoverable capital for the next deal without selling this one.
- Cap rate 7.1% vs local median 1.1% in Buckeye Lake — top-decile yield for the area; either an underpriced asset or a hidden risk that comps aren't pricing in. Stress-test before assuming the spread holds.
- This rent runs 30% of the median local income ($83k/yr) — at the standard rent-burdened threshold; future hikes will face affordability resistance.
Questions for listing agent
- Built in 1930 — when were the roof, HVAC, electrical panel, plumbing, and water heater last replaced?
- Is there a deadline driving the sale (1031 exchange, divorce, estate, relocation)? That informs how much negotiation room exists.
- Schools are F-rated, which usually means shorter tenancies and higher turnover. Who's the typical renter profile here, and what's been the actual vacancy rate?
- The area grade is low — what's the realistic commute time and amenity access for the typical tenant pool here? Any planned neighborhood developments (good or bad) we should know about?
- What's the average days-on-market for RENTAL listings here right now (not sales)? A rising rental-DOM trend means longer vacancies and softer asking-rent achievability than the comps imply.
- What's the recent tenant-quality profile in this submarket — average credit score on applications, eviction rate, late-payment / NSF rate, and stable-employment percentage? A property-management company in the area should have these aggregated.
- How much new for-sale + rental construction is in the pipeline within 1–3 miles? Heavy new supply typically softens prices + rents 12–24 months out; constrained supply supports both.
CashFlowRE · CFR-1H0DYR3CG3G3FA
· Data 1 day ago
cashflowre.app · 2026-05-29