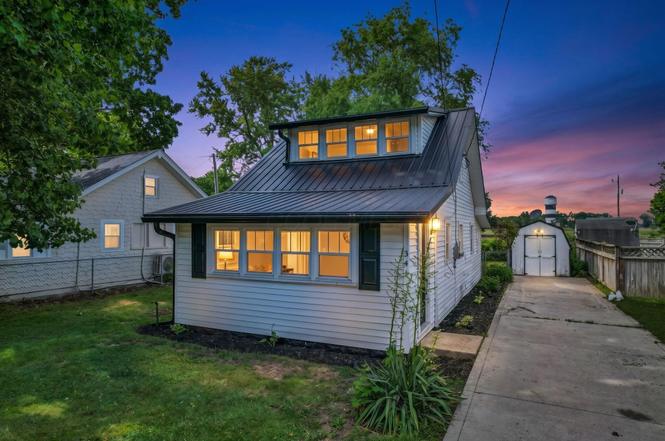
341 Highland Ave · Buckeye Lake, OH
Flood risk 1/10 · Minimal
- FEMA flood zone
- X (unshaded)
- Chance of flooding over 30 yrs
- 0.0%
- Est. flood insurance / yr
- $507 – $1,088
Fire risk 1/10 · Minimal
- Est. fire insurance / yr
- $713 – $1,323
Heat risk 3/10 · Minor
- Hot days now (above 98°F)
- 7 days/yr
- Hot days in 30 yrs
- 18 days/yr
Wind risk 2/10 · Minimal
- Chance of severe wind over 30 yrs
- 1.0%
Air-quality risk 2/10 · Minimal
- Unhealthy air days now
- 0 days/yr
- Unhealthy air days in 30 yrs
- 1 days/yr
Risk factors via First Street. Map © Google.
Why this score? — see what drove the D+ grade
The composite is a weighted blend of 9 inputs, each scored 0–100. Each bar is that input's sub-score; the figure is the points it added to the 100-point composite (weight × sub-score).
- Cash flow +17.1/30.0
- Appreciation +7.1/10.0
- DSCR +5.3/10.0
- 1% rule +4.1/10.0
- Schools +4.0/10.0
- ARV discount +3.9/15.0
- Livability +3.3/5.0
- Rent growth +2.5/5.0
- Condition / age +2.5/5.0
$229,900
🖨 Deal sheet 📄 Offer letter ✓ Due diligence
Listing remarks MLS
Cottage at Buckeye Lake! Sun Room, Fenced Yard, Shed! Priced right for repairs that you will want to make! Easy to show and make offer! On crawl! Price reduced 4/17!
Key facts
- Modern finishes
- Ample cabinet space
- Functional layout
Tags
Property features AI
Exterior
- Utilities: Public water; Public sewer
- Home design: Single-family residence; One and one-half stories; Built in 1930; No shared/common walls
- Construction: Block foundation
- Exterior features: Lot in the Myers subdivision
Interior
- Bedrooms: One main-level bedroom
- Bathrooms: One full bathroom
- Interior features: Crawl space basement
Neighborhood map
What this means for you Summary
Snapshot
- This is a 2-bed/1.0-bath single-family listed at $230k.
Deal economics
- At list price, monthly cash flow is $159 ($2k/yr) — positive.
- The deal already cash-flows at list — no discount required.
- To meet the 1% rule (rent ≥ 1% of price), the offer needs to be $209k (9.2% below list).
- Recommended offer: $209k (9.2% below list) — sets the bar for 1% rule.
- Cap rate 7.1% vs local median 1.1% in Buckeye Lake — top-decile yield for the area; either an underpriced asset or a hidden risk that comps aren't pricing in. Stress-test before assuming the spread holds.
Location & tenants
- Location reads 66/100 on livability (#671 in OH) — a middle-class / working-renter tenant base. Strengths: crime A+, cost of living A+, housing A+; Watch: employment C-, schools F, amenities F.
- Lakewood Local (rural): math 44% / reading 49% proficiency, ranked #481 of 656 in OH (top 73%) — families likely to look elsewhere, expect single-tenant / working-renter base with shorter leases.
- Market conditions: 31 active listings in the ZIP; 2 comparable units currently listed for rent nearby; solid renter incomes; 159 units permitted in Licking County in 2024 (0 in 5+ unit buildings).
- This rent runs 30% of the median local income ($83k/yr) — at the standard rent-burdened threshold; future hikes will face affordability resistance.
Forward outlook
- In year one you build about $11k of equity ($2k loan paydown + $9k appreciation (4.1% local appreciation)).
- At projected returns (4.1% appreciation + 3.0% rent growth), your $64k cash investment doubles in ~5 years — after that, you're playing with house money.
- By year 4, paydown + projected appreciation supports a ~$37k cash-out refi (75% LTV) — recoverable capital for the next deal without selling this one.
Negotiation context
- Only 7 days on market — expect competitive offers; lowballing is unlikely to land.
- 2 sale attempts since 21y ago with the ask held roughly flat each time — persistent listings suggest the price (not the market) is what's stuck; bring a comps-based counter.
- Current owner paid $40k; list at $230k implies a 476% gain — meaningful room to come down on a strong offer.
Risks & watch-outs
- Watch-outs: built in 1930 — expect roof / HVAC / electrical / plumbing capex.
Questions for the listing agent
- Built in 1930 — when were the roof, HVAC, electrical panel, plumbing, and water heater last replaced?
- Is there a deadline driving the sale (1031 exchange, divorce, estate, relocation)? That informs how much negotiation room exists.
- Schools are F-rated, which usually means shorter tenancies and higher turnover. Who's the typical renter profile here, and what's been the actual vacancy rate?
- The area grade is low — what's the realistic commute time and amenity access for the typical tenant pool here? Any planned neighborhood developments (good or bad) we should know about?
- What's the average days-on-market for RENTAL listings here right now (not sales)? A rising rental-DOM trend means longer vacancies and softer asking-rent achievability than the comps imply.
- What's the recent tenant-quality profile in this submarket — average credit score on applications, eviction rate, late-payment / NSF rate, and stable-employment percentage? A property-management company in the area should have these aggregated.
- How much new for-sale + rental construction is in the pipeline within 1–3 miles? Heavy new supply typically softens prices + rents 12–24 months out; constrained supply supports both.
Investment metrics
- 1% rule
- 0.91% ✗
- Cap rate
- 7.13%
- Cash-on-cash
- 2.97%
- DSCR
- 1.13
- GRM
- 9.2
CMA / ARV
- ARV (on-the-fly)
- $212,949
- Comps found
- 12
Show comp detail 12 sales within ~0.75 mi
| Address | Dist | Beds/Ba | Sqft | Sold | Price | $/sf | Match |
|---|---|---|---|---|---|---|---|
| 331 Highland Ave | 0.01mi | 3/1.0 (+1) | 944 (+6%) | 6mo | $100,000 | $106 | 80 |
| 188 Grandstaff Ave | 0.24mi | 2/2.0 | 900 (+1%) | 8mo | $411,000 | $457 | 76 |
| 225 East St | 0.12mi | 3/1.0 (+1) | 840 (-6%) | 4mo | $120,000 | $143 | 76 |
| 306 Highland Ave | 0.04mi | 3/1.0 (+1) | 960 (+8%) | 10mo | $249,000 | $259 | 72 |
| 193 Park St | 0.14mi | 2/1.0 | 940 (+6%) | 19mo | $193,000 | $205 | 69 |
| 173 Highland Ave | 0.16mi | 2/1.5 | 980 (+10%) | 7mo | $233,000 | $238 | 68 |
| 186 Grandstaff Ave | 0.24mi | 2/1.0 | 766 (-14%) | 6mo | $370,000 | $483 | 60 |
| 142 6th Ave | 0.18mi | 2/1.0 | 768 (-14%) | 11mo | $195,000 | $254 | 60 |
| 87 Central Ave | 0.25mi | 3/1.0 (+1) | 976 (+10%) | 13mo | $204,000 | $209 | 56 |
| 67 Nautica Way | 0.25mi | 2/1.0 | 780 (-12%) | 14mo | $351,000 | $450 | 56 |
| 126 Cliff St | 0.67mi | 2/1.0 | 922 (+4%) | 13mo | $220,000 | $239 | 52 |
| 63 Elliott Ave | 0.68mi | 1/1.0 (-1) | 979 (+10%) | 15mo | $37,500 | $38 | 34 |
Match score weights: distance 35% · size 25% · config 20% · recency 20%. Top-matched comps best support the ARV.
Projected returns pro-forma
4.12% appreciation · 3.0% rent growth · sell at horizon
- IRR
- 13.2%
- Equity multiple
- 1.80×
- Total profit
- $51,689
- Equity at exit
- $118,126
- IRR
- 14.5%
- Equity multiple
- 3.38×
- Total profit
- $153,446
- Equity at exit
- $194,463
Cash invested: $64,372 (down + closing). Projections, not guarantees.
Landlord ↔ Tenant lean methodology
- Overall (STATE)
- 73 Landlord-Friendly
- State Ohio
- 73 Landlord-Friendly · R+6
- County
- — inherits STATE
- City
- — inherits STATE
ZIP-level market 43008
- Home prices YoY
- 1.4%
- Active inventory
- 31
- Price-to-rent
- 9.2×
Monthly cashflow live
- Estimated rent
- $2,088 medium interval (Pro) →
- Mortgage (P&I)
- −$1,206
- Tax from tax record
- −$189 /mo · $2,266/yr
- Insurance
- −$96
- HOA
- −$0
- Vacancy / Maint / Mgmt
- −$439
- Net cashflow
- $159
Break-even live
UW: 25.0% down · 7.5% · 30yr · 1.5% tax · 5.0% vac · 8.0% maint · 8.0% mgmt
Financing live
Cash to close
- Down payment
- $57,475
- Closing costs
- $6,897
- Reserves months
- —
- Total cash needed
- —
Loan-product check · same deal, 3 products live
Conventional
25% down · 7.5% · 30yr
- Down + closing
- —
- Monthly P&I
- —
- Monthly cashflow
- —
- DSCR
- —
- Eligible?
- —
Personal DTI + credit; lowest rate.
DSCR
20% down · 8.5% · 30yr
- Down + closing
- —
- Monthly P&I
- —
- Monthly cashflow
- —
- DSCR
- —
- Eligible?
- —
No personal income docs; deal must DSCR.
Hard money
10% down · 12.0% · 12mo
- Down + closing
- —
- Monthly P&I
- —
- Monthly cashflow
- —
- DSCR
- —
- Eligible?
- —
Short-term bridge; refi at stabilization.
Rent comps 2 comps
| Address | Beds | Baths | Sqft | Rent | $/sqft | DOM | Units | Dist |
|---|---|---|---|---|---|---|---|---|
| 5118 Walnut Rd Apt B Buckeye Lake, OH | 2.0 | 2.0 | 1040 | $2,000 | $1.92 | 43d | 1 | 0.62mi |
| 4956 Island Dr NE Thornville, OH | 2.0 | 1.0 | 680 | $2,295 | $3.38 | 1d | 1 | 1.30mi |
Listing history 8 events
-
2026-06-19price $229,900 Active 7 DOM
-
2026-06-18days on market $235,000 Active 7 DOM
-
2026-06-17days on market $235,000 Active 6 DOM
-
2026-06-16days on market $235,000 Active 5 DOM
-
2026-06-15days on market $235,000 Active 4 DOM
-
2026-06-13days on market $235,000 Active 2 DOM
-
2026-06-13remarks 699-char remark
-
2026-06-13$235,000 Active 1 DOM
ⓘ Source: listings_history table (triggers on properties + properties_extension) + one-shot
backfill from property_details.listing_events for pre-trigger history.
Tax reassessment forecast OH · Partial reset (capped growth)
- Current annual tax
- $2,266 · $189/mo
- Projected year-2 tax
- $2,926 · $244/mo
- Expected delta
- +$660/yr (+$55/mo · 29.1%)
ⓘ Screening estimate from a state-policy table — verify with the county assessor before closing.
Climate risk First Street
- Flood 1/10 Low FEMA zone X (unshaded) · 0% chance over 30 yrs
- Wildfire 1/10 Low
- Heat 3/10 Moderate 7 d/yr ≥98°F today · 18 d/yr by 30 yrs out
- Wind 2/10 Low 100% chance of damaging wind over 30 yrs
- Air quality 2/10 Low 0 unhealthy d/yr today · 1 by 30 yrs out
Nearby sold comps map
Loading sold comps map…
Walkable amenities ~0.75 mi
Loading nearby amenities…
Taxation est. · year 1
- Rental income
- $25,059
- − Mortgage interest
- −$12,878
- − Property taxes
- −$2,266
- − Insurance
- −$1,150
- − Repairs & maintenance
- −$2,005
- − Management
- −$2,005
- − Depreciation
- −$6,688
- Taxable loss
- −$1,932
- Est. tax savings @ 24.0%
- +$464
- After-tax cash flow
- $2,377/yr
For passive investors: Depreciation is non-cash, so a rental often shows a tax loss while cash-flowing — sheltering income. Rental losses are passive: they offset passive income freely, and up to $25,000/yr can offset ordinary (W-2) income if you actively participate and your MAGI is under $100k (phasing out to $0 by $150k); unused losses carry forward. On sale, claimed depreciation is recaptured at up to 25%, and gains may owe capital-gains tax (a 1031 exchange can defer both). Figures are a year-1 estimate at your 24.0% rate — not tax advice; consult a CPA.
Schools (NCES district)
- District
- Lakewood Local
- NCES district ID
- 3904799
- Math proficiency
- 44% ▼ -15.00%
- Reading proficiency
- 49% ▼ -10.00%
- Median HH income
- $51,143
- Composite
- 39.98/100
- National rank
- #3834
- State rank
- #481 of 656 in OH
Livability — Buckeye Lake
- Score
- 66/100
- State rank
- #671
- US rank
- #11844
Category grades
Schools grade is shown separately in the Schools card above.
Census & demographics
- Census place
- Buckeye Lake, OH
- County
- Licking · 160,960 people
- City population
- 2,419
- Metro
- Columbus, OH
- Population (ZIP)
- 2,419
- Household income
- $82,750
- Rent vs Own
Population outlook (Licking County) Hauer SSP2
- Today (2025)
- 178,210 people
- By 2030
- 180,917 · +1.5%
- By 2040
- 183,885 · +3.2%
- By 2050
- 182,985 · +2.7%
- By 2075
- 178,377 · +0.1%
- By 2100
- 161,075 · -9.6%
Race, ethnicity, and origin ACS 2023
- Neighborhood character
- Predominantly White (91%)
- Race & ethnicity
- White 91% Two or more races 6% Hispanic / Latino 5%
- Hispanic origin (detail)
- Mexican 2%
- Common ancestry
- Italian 6% Iranian 4% Lithuanian 2%
- Foreign-born
- 2% · Canada
- Languages at home
- 98% English-only · Spanish 2%
Political lean MEDSL · Licking
- 2024 margin
- Solid R (+30.0) · D 34.5% · R 64.6%
- 2008→2024 swing
- -14.2pp toward R · 2008: -15.8pp · 2024: -30.0pp
- All cycles
- 2024: R+30.0 2020: R+28.1 2016: R+28.9 2012: R+14.7 2008: R+15.8
Not yet ingested
- Civics
- —
Market trends
- HPI YoY
- ▲ 4.12%
- Current HPI
- 293.8256
- Rent YoY
- —
- Metro
- —
- State GDP YoY
- ▲ 1.98%
- F500 in state
- 48
Industry mix (Fortune 500 HQ in OH)
| Industry | F500 HQs | Revenue |
|---|---|---|
| Insurance | 3 | $145B |
|
||
| Industrial Machinery | 3 | $49B |
|
||
| Financial Services | 3 | $24B |
|
||
| Consumer Goods | 2 | $93B |
|
||
| Aerospace / Defense | 2 | $47B |
|
||
| Utilities | 2 | $33B |
|
||
Price history
+487.5% since first listed5 events — show timeline
- 2026-06-11 Listed $235,000 CBRMLS
- 2026-06-10 Coming Soon $235,000 CBRMLS
- 2006-05-31 Sold (MLS) $39,900 CBRMLS
- 2005-12-16 Listed $39,900 CBRMLS
- 2000-05-24 Sold (Public Records) $40,000 Public Records
Property tax history
+5.6%/yrLatest (2025): $2,266 · +10.1% YoY. Source: county tax records.
Cash-flow waterfall
monthlySold comps — $/sqft
last 12 mo · ≤1 miLoading sold comps…