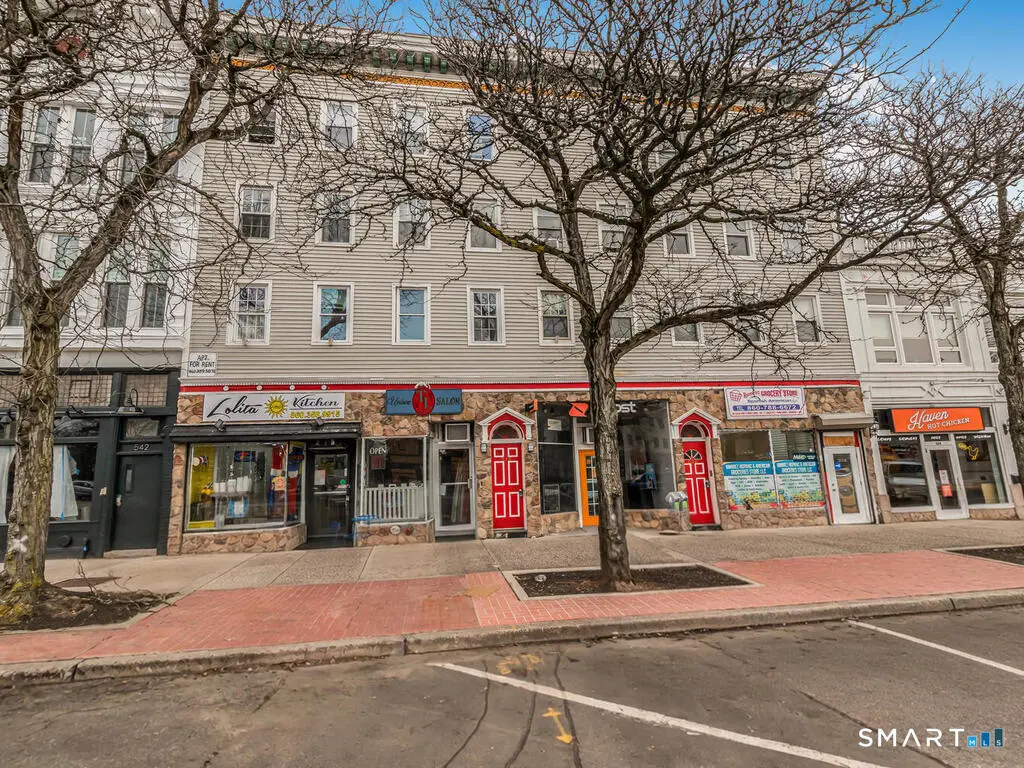
530 Main St
Middletown, CT 06457
$1,500,000B
1 bd · 1.0 ba ·
11,033 sqft ·
Built 1860
· MultiFamily
· Under Contract
· 17 DOM
Cashflow @ list (25.0% down · 7.5%)
Estimated rent
$24,961/mo
Mortgage (P&I)
−$7,866
Tax + insurance
−$2,500
HOA
−$0
Vac / Maint / Mgmt
−$5,242
Net cashflow
$9,353/mo
Annual
$112,236/yr
Cap rate
13.78%
Cash-on-cash
26.72%
DSCR
2.19
1% rule
1.66%
Cash to close
$420,000
Investor read
- This is a 1-bed/1.0-bath multifamily listed at $1.50M. Condition is rated good.
- At list price, monthly cash flow is $9k ($112k/yr) — positive.
- The deal already cash-flows at list — no discount required.
- Meets the 1% rule at list price ($25k rent vs $1.50M).
- It's been on market 17 days — a 2% lower offer ($1.48M) is reasonable based on typical stale-listing flexibility.
- Recommended offer: $1.48M (1.5% below list) — sets the bar for market timing.
- Local home prices are declining (-3.0%/yr); year-one equity from $10k of loan paydown is wiped out by about $45k of value loss. Plan a longer hold.
- Location reads 81/100 on livability (#17 in CT, #1,390 nationally) — a professional / high-income tenant draw. Strengths: crime A+, amenities A+, health & safety A+; Watch: commute F.
- Middletown School District (urban): math 24% / reading 44% proficiency, ranked #113 of 153 in CT (top 74%) — families likely to look elsewhere, expect single-tenant / working-renter base with shorter leases.
- Zoned schools: Macdonough School (math 32% / reading 42%, grade F, #318 of 553 statewide, top 60%, 227 students, 66% FRL); Middletown High School (math 25% / reading 52%, grade F, #111 of 194 statewide, top 57%, 1,214 students, 49% FRL) — zoned schools average 58% FRL vs 38% district-wide (19 pts higher); higher-poverty schools than district average — tighter screening recommended.
- Watch-outs: built in 1860 — expect roof / HVAC / electrical / plumbing capex.
- Market conditions: Rents flat; 143 active listings in the ZIP; 1 comparable units currently listed for rent nearby; solid renter incomes; 278 units permitted in Lower Connecticut River Valley Planning Region in 2024 (89 in 5+ unit buildings).
- 5 sale attempts since 16y ago with the ask held roughly flat each time — persistent listings suggest the price (not the market) is what's stuck; bring a comps-based counter.
- At projected returns (-3.0% appreciation + 0.2% rent growth), your $420k cash investment doubles in ~6 years — after that, you're playing with house money.
- Cap rate 13.8% vs local median 3.7% in Middletown — top-decile yield for the area; either an underpriced asset or a hidden risk that comps aren't pricing in. Stress-test before assuming the spread holds.
- At $24,961/mo this rent would consume 377% of the median local household income ($79k/yr) (locally 2196% of renters already pay >50% of income on rent) — very limited rent-growth headroom before tenants either downsize or default.
Questions for listing agent
- Built in 1860 — when were the roof, HVAC, electrical panel, plumbing, and water heater last replaced?
- Is there a deadline driving the sale (1031 exchange, divorce, estate, relocation)? That informs how much negotiation room exists.
- What's the average days-on-market for RENTAL listings here right now (not sales)? A rising rental-DOM trend means longer vacancies and softer asking-rent achievability than the comps imply.
- What's the recent tenant-quality profile in this submarket — average credit score on applications, eviction rate, late-payment / NSF rate, and stable-employment percentage? A property-management company in the area should have these aggregated.
- How much new apartment / multifamily construction is in the pipeline within 1–3 miles? Heavy new supply (>2% of stock underway) typically softens rents 12–24 months out; light construction supports rent growth.
CashFlowRE · CFR-1J7DXHEQGSSVT9
· Data 3 weeks ago
cashflowre.app · 2026-05-29