 Multi-family
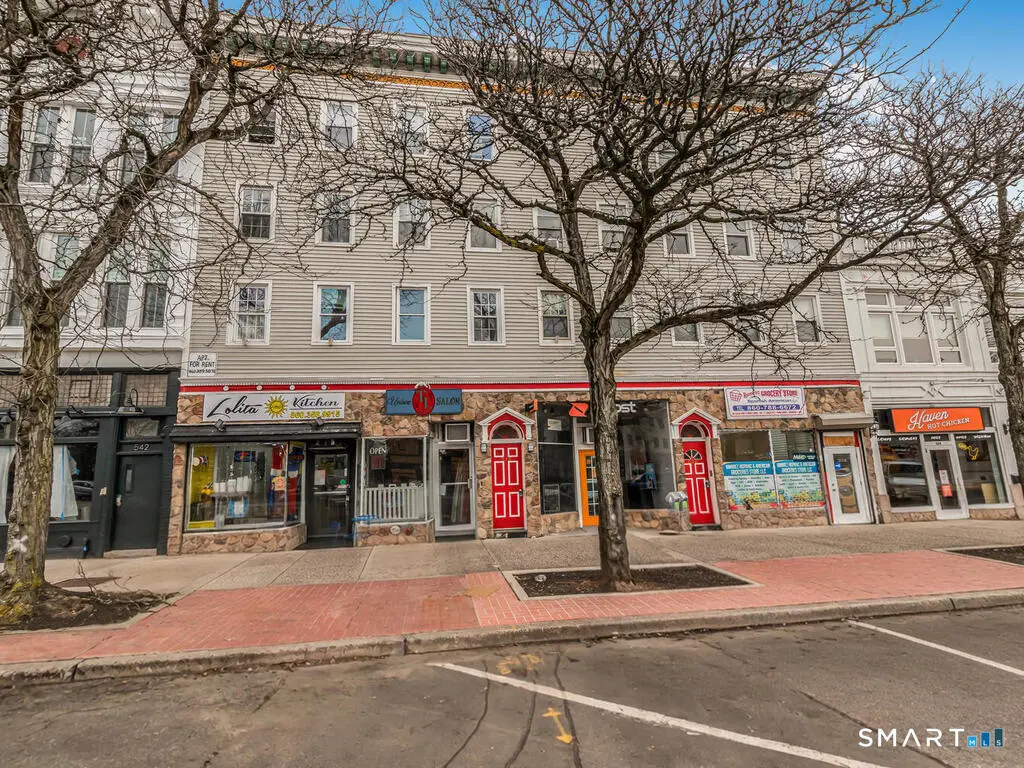
530 Main St · Middletown, CT
Flood risk No data
- FEMA flood zone
- —
- Chance of flooding over 30 yrs
- —
- Est. flood insurance / yr
- —
Fire risk No data
- Est. fire insurance / yr
- —
Heat risk No data
- Hot days now (above threshold)
- —
- Hot days in 30 yrs
- —
Wind risk No data
- Chance of severe wind over 30 yrs
- —
Air-quality risk No data
- Unhealthy air days now
- —
- Unhealthy air days in 30 yrs
- —
Risk factors via First Street. Map © Google.
Why this score? — see what drove the B grade
The composite is a weighted blend of 9 inputs, each scored 0–100. Each bar is that input's sub-score; the figure is the points it added to the 100-point composite (weight × sub-score).
- Cash flow +30.0/30.0
- 1% rule +10.0/10.0
- DSCR +10.0/10.0
- ARV discount +7.5/15.0
- Livability +4.0/5.0
- Condition / age +3.8/5.0
- Schools +3.0/10.0
- Rent growth +2.6/5.0
- Appreciation +0.0/10.0
$1,500,000
🖨 Deal sheet 📄 Offer letter ✓ Due diligence
Multi-family units
County records classify this as Multi-Family (5+ Unit). Listing-text estimate: 1 unit. estimate disagrees with records
5+ unit building — per-unit beds/baths from public records are typically unavailable; the breakdown below (if shown) is an estimate from the listing text.
Listing remarks
Prime Mixed-Use Investment Opportunity - Downtown Middletown, CT. This asset currently produces 9.7 cap annually, features a total of 16 units, including 4 retail storefronts and 12 on1-bedroom residential apartments. The retail spaces are currently occupied by established neighborhood businesses, including a grocery store, Boost Mobile, a barber shop, and a convenience store-providing steady foot traffic and consistent rental income. The residential component consists of twelve 1-bedroom units, offering strong demand in this vibrant downtown location. The asset include: mostly of windows recently replaced, hardwired smoke detectors throughout, fire sprinkler system installed, tenants cover
Key facts
- Street parking
- High visibility
- Retail storefronts
Tags
Property features AI
Finance
- Other: Total living area approximately 11,033 (public record); Total rooms: 4; Total number of units: 16
- Financial info: Assessed value available
Exterior
- Utilities: Public water connected; Public sewer connected; Other type of hot water system
- Home design: Multi-family property (5+ units)
- Construction: Frame construction; Concrete foundation
- Exterior features: Vinyl siding; Level lot
Interior
- Bedrooms: 1 bedroom
- Bathrooms: 1 full bathroom
- Heating & cooling: Hot water heating; Heated by electric and natural gas
- Interior features: Full basement
Neighborhood map
What this means for you Summary
Snapshot
- This is a 1-bed/1.0-bath multifamily listed at $1.50M. Condition is rated good.
Deal economics
- At list price, monthly cash flow is $9k ($112k/yr) — positive.
- The deal already cash-flows at list — no discount required.
- Meets the 1% rule at list price ($25k rent vs $1.50M).
- Recommended offer: $1.48M (1.5% below list) — sets the bar for market timing.
- Cap rate 13.8% vs local median 3.7% in Middletown — top-decile yield for the area; either an underpriced asset or a hidden risk that comps aren't pricing in. Stress-test before assuming the spread holds.
Location & tenants
- Location reads 81/100 on livability (#17 in CT, #1,390 nationally) — a professional / high-income tenant draw. Strengths: crime A+, amenities A+, health & safety A+; Watch: commute F.
- Middletown School District (urban): math 24% / reading 44% proficiency, ranked #113 of 153 in CT (top 74%) — families likely to look elsewhere, expect single-tenant / working-renter base with shorter leases.
- Zoned schools: Macdonough School (math 32% / reading 42%, grade F, #318 of 553 statewide, top 60%, 227 students, 66% FRL); Middletown High School (math 25% / reading 52%, grade F, #111 of 194 statewide, top 57%, 1,214 students, 49% FRL) — zoned schools average 58% FRL vs 38% district-wide (19 pts higher); higher-poverty schools than district average — tighter screening recommended.
- Market conditions: Rents flat; 143 active listings in the ZIP; 1 comparable units currently listed for rent nearby; solid renter incomes; 278 units permitted in Lower Connecticut River Valley Planning Region in 2024 (89 in 5+ unit buildings).
- At $24,961/mo this rent would consume 377% of the median local household income ($79k/yr) (locally 2196% of renters already pay >50% of income on rent) — very limited rent-growth headroom before tenants either downsize or default.
Forward outlook
- Local home prices are declining (-3.0%/yr); year-one equity from $10k of loan paydown is wiped out by about $45k of value loss. Plan a longer hold.
- At projected returns (-3.0% appreciation + 0.2% rent growth), your $420k cash investment doubles in ~6 years — after that, you're playing with house money.
Negotiation context
- It's been on market 17 days — a 2% lower offer ($1.48M) is reasonable based on typical stale-listing flexibility.
- 5 sale attempts since 16y ago with the ask held roughly flat each time — persistent listings suggest the price (not the market) is what's stuck; bring a comps-based counter.
Risks & watch-outs
- Watch-outs: built in 1860 — expect roof / HVAC / electrical / plumbing capex.
Questions for the listing agent
- Built in 1860 — when were the roof, HVAC, electrical panel, plumbing, and water heater last replaced?
- Is there a deadline driving the sale (1031 exchange, divorce, estate, relocation)? That informs how much negotiation room exists.
- What's the average days-on-market for RENTAL listings here right now (not sales)? A rising rental-DOM trend means longer vacancies and softer asking-rent achievability than the comps imply.
- What's the recent tenant-quality profile in this submarket — average credit score on applications, eviction rate, late-payment / NSF rate, and stable-employment percentage? A property-management company in the area should have these aggregated.
- How much new apartment / multifamily construction is in the pipeline within 1–3 miles? Heavy new supply (>2% of stock underway) typically softens rents 12–24 months out; light construction supports rent growth.
Investment metrics
- 1% rule
- 1.66% ✓
- Cap rate
- 13.78%
- Cash-on-cash
- 26.72%
- DSCR
- 2.19
- GRM
- 5.0
CMA / ARV
No comps found within radius.
Projected returns pro-forma
-3.0% appreciation · 0.22% rent growth · sell at horizon
- IRR
- 17.4%
- Equity multiple
- 1.68×
- Total profit
- $285,078
- Equity at exit
- $223,655
- IRR
- 23.8%
- Equity multiple
- 2.79×
- Total profit
- $753,151
- Equity at exit
- $129,693
Cash invested: $420,000 (down + closing). Projections, not guarantees.
Landlord ↔ Tenant lean methodology
- Overall (STATE)
- 27 Tenant-Leaning
- State Connecticut
- 27 Tenant-Leaning · D+7
- County
- — inherits STATE
- City
- — inherits STATE
ZIP-level market 06457
- Rents YoY
- 0.2%
- Active inventory
- 143
- Price-to-rent
- 79.6×
Monthly cashflow live
- Estimated rent
- $24,961 high interval (Pro) →
- Mortgage (P&I)
- −$7,866
- Tax est. 1.5%
- −$1,875 /mo · $22,500/yr
- Insurance
- −$625
- HOA
- −$0
- Vacancy / Maint / Mgmt
- −$5,242
- Net cashflow
- $9,353
Break-even live
16-unit breakdown (identical units grouped — click to expand)
| Units | Beds | Baths | Est. rent |
|---|---|---|---|
| 12× units | 1 | 1 | $18,852 |
| #1 | 1 | 1 | $1,571 |
| #2 | 1 | 1 | $1,571 |
| #3 | 1 | 1 | $1,571 |
| #4 | 1 | 1 | $1,571 |
| #5 | 1 | 1 | $1,571 |
| #6 | 1 | 1 | $1,571 |
| #7 | 1 | 1 | $1,571 |
| #8 | 1 | 1 | $1,571 |
| #9 | 1 | 1 | $1,571 |
| #10 | 1 | 1 | $1,571 |
| #11 | 1 | 1 | $1,571 |
| #12 | 1 | 1 | $1,571 |
| 4× units | 0 | 0 | $6,108 |
| #13 | 0 | 0 | $1,527 |
| #14 | 0 | 0 | $1,527 |
| #15 | 0 | 0 | $1,527 |
| #16 | 0 | 0 | $1,527 |
| Total (16 units) | $24,961 | ||
UW: 25.0% down · 7.5% · 30yr · 1.5% tax · 5.0% vac · 8.0% maint · 8.0% mgmt
Financing live
Cash to close
- Down payment
- $375,000
- Closing costs
- $45,000
- Reserves months
- —
- Total cash needed
- —
Loan-product check · same deal, 3 products live
Conventional
25% down · 7.5% · 30yr
- Down + closing
- —
- Monthly P&I
- —
- Monthly cashflow
- —
- DSCR
- —
- Eligible?
- —
Personal DTI + credit; lowest rate.
DSCR
20% down · 8.5% · 30yr
- Down + closing
- —
- Monthly P&I
- —
- Monthly cashflow
- —
- DSCR
- —
- Eligible?
- —
No personal income docs; deal must DSCR.
Hard money
10% down · 12.0% · 12mo
- Down + closing
- —
- Monthly P&I
- —
- Monthly cashflow
- —
- DSCR
- —
- Eligible?
- —
Short-term bridge; refi at stabilization.
Rent comps 1 comps
| Address | Beds | Baths | Sqft | Rent | $/sqft | DOM | Units | Dist |
|---|---|---|---|---|---|---|---|---|
| 230 Main St Unit 2B Portland, CT | 1.0 | 1.0 | 7748 | $1,295 | $0.17 | 23d | 1 | 0.97mi |
Listing history 10 events
-
2026-04-29status Under Contract
-
2026-04-11$1,500,000 Active
-
2015-05-31historical
-
2014-12-03$950,000
-
2013-06-07historical
-
2011-08-14$599,000
-
2011-07-31historical
-
2011-04-15$1,000,000
-
2011-03-31historical
-
2010-12-08$999,990
ⓘ Source: listings_history table (triggers on properties + properties_extension) + one-shot
backfill from property_details.listing_events for pre-trigger history.
Nearby sold comps map
Loading sold comps map…
Walkable amenities ~0.75 mi
Loading nearby amenities…
Taxation est. · year 1
- Rental income
- $299,532
- − Mortgage interest
- −$84,023
- − Property taxes
- −$22,500
- − Insurance
- −$7,500
- − Repairs & maintenance
- −$23,963
- − Management
- −$23,963
- − Depreciation
- −$43,636
- Taxable income
- $93,947
- Est. tax owed @ 24.0%
- −$22,547
- After-tax cash flow
- $89,689/yr
For passive investors: Depreciation is non-cash, so a rental often shows a tax loss while cash-flowing — sheltering income. Rental losses are passive: they offset passive income freely, and up to $25,000/yr can offset ordinary (W-2) income if you actively participate and your MAGI is under $100k (phasing out to $0 by $150k); unused losses carry forward. On sale, claimed depreciation is recaptured at up to 25%, and gains may owe capital-gains tax (a 1031 exchange can defer both). Figures are a year-1 estimate at your 24.0% rate — not tax advice; consult a CPA.
Condition & rehab AI · 12 photos
This multi-family property in downtown Middletown, CT is in good condition with minimal repairs needed. It offers a good investment opportunity with steady rental income from retail and residential units.
Value-add opportunities
- Both Painting exterior and interior — Fresh paint enhances curb appeal and interior aesthetics
- Both Landscaping improvements — Enhances curb appeal and attracts potential tenants
- Both HVAC maintenance — Ensures comfort and energy efficiency
- Both Smoke detector replacement — Ensures safety and complies with regulations
Renovation cost estimate screening
Value-add ROI direction
- Both Painting exterior and interior — Fresh paint enhances curb appeal and interior aesthetics ↑
- Both Landscaping improvements — Enhances curb appeal and attracts potential tenants ↑
- Both HVAC maintenance — Ensures comfort and energy efficiency ↑
- Both Smoke detector replacement — Ensures safety and complies with regulations ↑
ⓘ Cost ranges are severity-bucket heuristics (US national rule-of-thumb). Get contractor quotes + a written scope before underwriting a rehab budget.
Schools (NCES district)
- District
- Middletown School District
- NCES district ID
- 0902490
- Math proficiency
- 24% ▼ -15.00%
- Reading proficiency
- 44% ▼ -8.00%
- Median HH income
- $60,733
- Composite
- 30.47/100
- National rank
- #6224
- State rank
- #113 of 153 in CT
Livability — Middletown
- Score
- 81/100
- State rank
- #17
- US rank
- #1390
Category grades
Schools grade is shown separately in the Schools card above.
Census & demographics
- Census place
- Middletown, CT
- County
- Middlesex County · 63,941 people
- City population
- 46,720
- Metro
- Hartford-East Hartford-Middletown, CT
- Population (ZIP)
- 46,720
- Household income
- $79,463
- Rent vs Own
- Severe rent burden
- 2196.0
Population outlook (Lower Connecticut River Valley County) Hauer SSP2
- By 2040
- 188,651
Race, ethnicity, and origin ACS 2023
- Neighborhood character
- Majority White (65%)
- Race & ethnicity
- White 65% Black 13% Hispanic / Latino 12% Two or more races 9% Asian 5%
- Hispanic origin (detail)
- Mexican 1% Puerto Rican 7%
- Common ancestry
- Romanian 9% Lithuanian 5% Slovak 2%
- Foreign-born
- 12% · Canada, China
- Languages at home
- 82% English-only · Spanish 6% Other Indo-European 4% Russian/Polish/Slavic 2%
Political lean MEDSL · Lower Connecticut River Valley
- 2024 margin
- D (+13.4) · D 55.9% · R 42.4% · Other 1.7%
- All cycles
- 2024: D+13.4
Not yet ingested
- Civics
- —
Market trends
- HPI YoY
- ▼ -470.20%
- Current HPI
- 255.1597
- Rent YoY
- ▲ 0.22%
- Metro
- Hartford-East Hartford-Middletown, CT
- State GDP YoY
- ▲ 1.06%
- F500 in state
- 38
Industry mix (Fortune 500 HQ in CT)
| Industry | F500 HQs | Revenue |
|---|---|---|
| Industrial Machinery | 4 | $38B |
|
||
| Insurance | 3 | $71B |
|
||
| Financial Services | 2 | $25B |
|
||
| Transportation / Logistics | 2 | $18B |
|
||
| Healthcare | 1 | $247B |
|
||
| Telecommunications | 1 | $55B |
|
||
Price history
+50.0% since first listed10 events — show timeline
- 2026-04-29 Pending — Smart MLS
- 2026-04-11 Listed $1,500,000 Smart MLS
- 2015-05-31 Listing Removed — Smart MLS
- 2014-12-03 Listed $950,000 Smart MLS
- 2013-06-07 Listing Removed — Smart MLS
- 2011-08-14 Listed $599,000 Smart MLS
- 2011-07-31 Listing Removed — Smart MLS
- 2011-04-15 Listed $1,000,000 Smart MLS
- 2011-03-31 Listing Removed — Smart MLS
- 2010-12-08 Listed $999,990 Smart MLS
Cash-flow waterfall
monthlySold comps — $/sqft
last 12 mo · ≤1 miLoading sold comps…