341 Comanche Plains Rd
La Marque, TX 77568
$254,000D-
3 bd · 2.5 ba ·
1,719 sqft ·
Built 2015
· SingleFamily
· Active
· 42 DOM
Cashflow @ list (25.0% down · 7.5%)
Estimated rent
$2,315/mo
Mortgage (P&I)
−$1,332
Tax + insurance
−$534
HOA
−$29
Vac / Maint / Mgmt
−$486
Net cashflow
$-66/mo
Annual
$-792/yr
Cap rate
5.98%
Cash-on-cash
-1.11%
DSCR
0.95
1% rule
0.91%
Cash to close
$71,120
Investor read
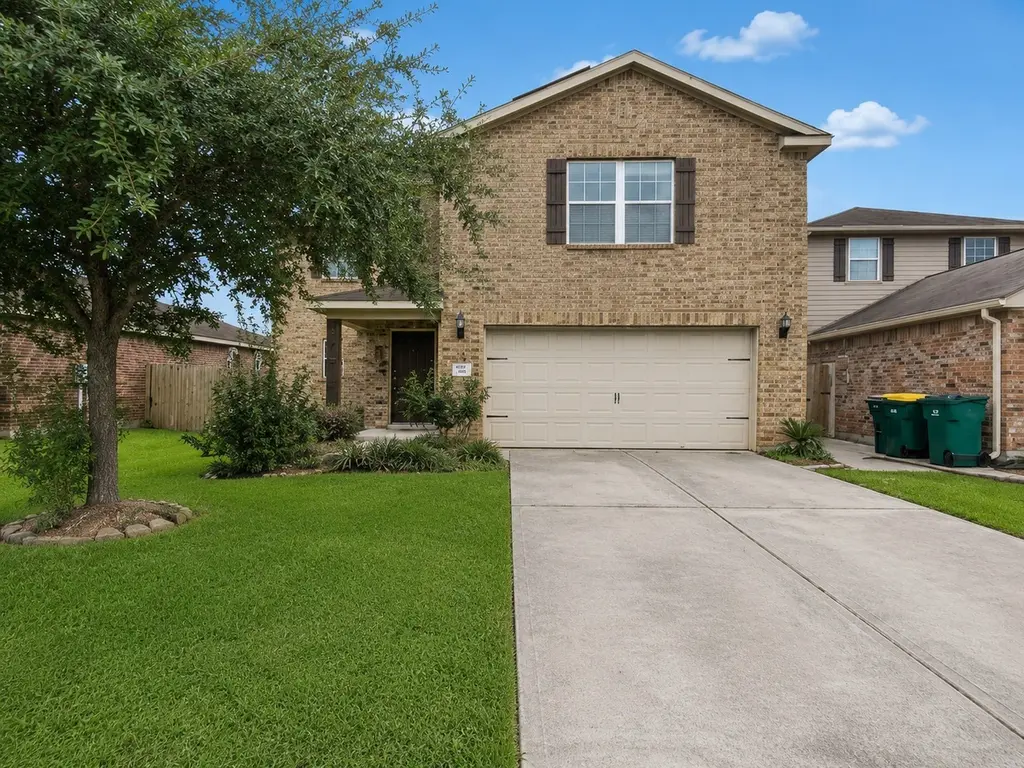
- This is a 3-bed/2.5-bath single-family listed at $254k.
- At list price, monthly cash flow is $-66 ($-792/yr) — negative.
- To cash-flow at today's rent, offer at most $242k (4.6% below list).
- To meet the 1% rule (rent ≥ 1% of price), the offer needs to be $232k (8.8% below list).
- It's been on market 42 days — a 3% lower offer ($246k) is reasonable based on typical stale-listing flexibility.
- Recommended offer: $232k (8.8% below list) — sets the bar for 1% rule.
- Local home prices are declining (-3.0%/yr); year-one equity from $2k of loan paydown is wiped out by about $8k of value loss. Plan a longer hold.
- Location reads 59/100 on livability (#1,136 in TX) — a working-class tenant base; expect higher turnover. Strengths: cost of living A+, housing A+; Watch: employment D, crime F, amenities F.
- Santa Fe ISD (suburban): math 38% / reading 39% proficiency, ranked #385 of 826 in TX (top 47%) — families likely to look elsewhere, expect single-tenant / working-renter base with shorter leases.
- Zoned schools: William F Barnett El (math 59% / reading 46%, grade C-, #720 of 4,322 statewide, top 17%, 646 students, 59% FRL); Santa Fe H S (math 19% / reading 34%, grade F, #1,228 of 1,632 statewide, top 76%, 1,369 students, 47% FRL) — zoned schools average 53% FRL vs 35% district-wide (18 pts higher); higher-poverty schools than district average — tighter screening recommended.
- Market conditions: Rents rising (+4.0%/yr); 654 active listings in the ZIP; 7 comparable units currently listed for rent nearby; rentals leasing fast (median 6d on market — plan ~1-2 weeks tenant-placement turnaround); 3,258 units permitted in Galveston County in 2024 (0 in 5+ unit buildings).
- Galveston County population projected at +43% by 2050 — long-run rental-demand tailwind backs the buy-and-hold thesis.
- 5 sale attempts since 10y ago with the ask held roughly flat each time — persistent listings suggest the price (not the market) is what's stuck; bring a comps-based counter.
- Climate carrying-cost: severe wind risk, 99% chance of damaging wind over 30y; extreme-heat days projected 7→28/yr by 2055 (HVAC capex compounding) — expect insurance premiums to compound above CPI over the hold.
- This rent runs 37% of the median local income ($75k/yr) — at the standard rent-burdened threshold; future hikes will face affordability resistance.
Questions for listing agent
- What do current leases actually rent for vs. the listed asking? Can we see a recent rent roll and the last 12 months of T-12 income?
- It's been on market 42 days. Have you received any prior offers? Is the seller open to a 9% concession, seller financing, or rate buy-down credit?
- What does the HOA fee cover, when was the last increase, and are there any pending special assessments or reserve-fund shortfalls?
- Is there a deadline driving the sale (1031 exchange, divorce, estate, relocation)? That informs how much negotiation room exists.
- Schools are F-rated, which usually means shorter tenancies and higher turnover. Who's the typical renter profile here, and what's been the actual vacancy rate?
- Crime grade is F in this area — have there been break-ins, vandalism, or insurance claims at this property in the last 3 years? What carrier currently insures it and at what premium?
- The area grade is low — what's the realistic commute time and amenity access for the typical tenant pool here? Any planned neighborhood developments (good or bad) we should know about?
- What's the average days-on-market for RENTAL listings here right now (not sales)? A rising rental-DOM trend means longer vacancies and softer asking-rent achievability than the comps imply.
CashFlowRE · CFR-1JC9XG5NB4T61M
· Data 2 days ago
cashflowre.app · 2026-05-29