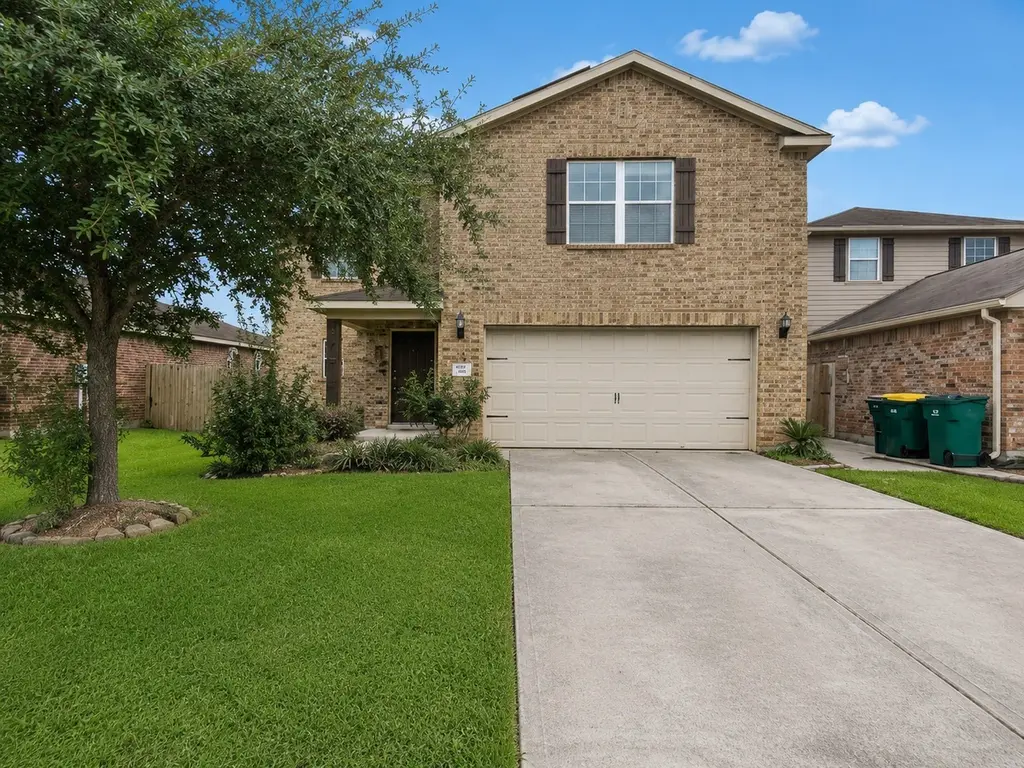
341 Comanche Plains Rd · La Marque, TX
Flood risk 3/10 · Minor
- FEMA flood zone
- X (unshaded)
- Chance of flooding over 30 yrs
- 0.2%
- Est. flood insurance / yr
- $507 – $1,088
Fire risk 4/10 · Minor
- Est. fire insurance / yr
- $1,222 – $2,270
Heat risk 10/10 · Severe
- Hot days now (above 110°F)
- 7 days/yr
- Hot days in 30 yrs
- 28 days/yr
Wind risk 9/10 · Severe
- Chance of severe wind over 30 yrs
- 99.0%
Air-quality risk 2/10 · Minimal
- Unhealthy air days now
- 1 days/yr
- Unhealthy air days in 30 yrs
- 1 days/yr
Risk factors via First Street. Map © Google.
Why this score? — see what drove the D- grade
The composite is a weighted blend of 9 inputs, each scored 0–100. Each bar is that input's sub-score; the figure is the points it added to the 100-point composite (weight × sub-score).
- Cash flow +11.9/30.0
- ARV discount +6.9/15.0
- 1% rule +4.1/10.0
- DSCR +3.5/10.0
- Rent growth +3.5/5.0
- Schools +3.5/10.0
- Livability +3.0/5.0
- Condition / age +2.5/5.0
- Appreciation +0.0/10.0
$254,000
🖨 Deal sheet 📄 Offer letter ✓ Due diligence
Listing remarks MLS
This charming LGI property offers the spacious Colorado layout with 3 bedrooms and 2 1/2 bathrooms, totaling 1719 square feet of living space. Nestled in the desirable Painted Meadows neighborhood, this home was built in 2015 and boasts modern amenities and stylish finishes throughout including new flooring in the living room and all new carpet upstairs. Be eco-friendly and save money this summer with solar panels! Home includes built-in Taexx pest control system to keep the bugs away. Don't miss the opportunity to make this house your new home! Contact us today for more information.
Key facts
- Two story residence
- Open dining area
- Private bath
Tags
Property features AI
Finance
- HOA & community: Painted Meadows CIA homeowners association; Annual HOA fee of $350 (includes recreation facilities); Community curbs
Exterior
- Parking: Attached garage with garage door opener; 2 garage spaces
- Utilities: Public water; Public sewer
- Home design: Residential property; Full ownership; Slab foundation; Composition roof; Built in 2015
- Construction: Brick and cement siding construction
- Exterior features: Deck; Patio; Private yard; Fenced backyard; Cleared lot in a subdivision; Concrete road access
Interior
- Kitchen: Dishwasher; Electric oven; Electric range; Disposal; Microwave; Oven
- Bedrooms: 3 rooms total
- Bathrooms: 2 full bathrooms; 1 half bathroom
- Heating & cooling: Central heating (electric and gas); Central electric air conditioning
- Interior features: Breakfast bar; Granite counters; Soaking tub; Separate shower; Tub/shower; Ceiling fans; Programmable thermostat
- Laundry & utility: Washer hookup; Electric dryer hookup
Neighborhood map
What this means for you Summary
Snapshot
- This is a 3-bed/2.5-bath single-family listed at $254k.
Deal economics
- At list price, monthly cash flow is $-66 ($-792/yr) — negative.
- To cash-flow at today's rent, offer at most $242k (4.6% below list).
- To meet the 1% rule (rent ≥ 1% of price), the offer needs to be $232k (8.8% below list).
- Recommended offer: $232k (8.8% below list) — sets the bar for 1% rule.
Location & tenants
- Location reads 59/100 on livability (#1,136 in TX) — a working-class tenant base; expect higher turnover. Strengths: cost of living A+, housing A+; Watch: employment D, crime F, amenities F.
- Santa Fe ISD (suburban): math 38% / reading 39% proficiency, ranked #385 of 826 in TX (top 47%) — families likely to look elsewhere, expect single-tenant / working-renter base with shorter leases.
- Zoned schools: William F Barnett El (math 59% / reading 46%, grade C-, #720 of 4,322 statewide, top 17%, 646 students, 59% FRL); Santa Fe H S (math 19% / reading 34%, grade F, #1,228 of 1,632 statewide, top 76%, 1,369 students, 47% FRL) — zoned schools average 53% FRL vs 35% district-wide (18 pts higher); higher-poverty schools than district average — tighter screening recommended.
- Market conditions: Rents rising (+4.0%/yr); 654 active listings in the ZIP; 7 comparable units currently listed for rent nearby; rentals leasing fast (median 5d on market — plan ~1-2 weeks tenant-placement turnaround); 3,258 units permitted in Galveston County in 2024 (0 in 5+ unit buildings).
- This rent runs 37% of the median local income ($75k/yr) — at the standard rent-burdened threshold; future hikes will face affordability resistance.
Forward outlook
- Local home prices are declining (-3.0%/yr); year-one equity from $2k of loan paydown is wiped out by about $8k of value loss. Plan a longer hold.
- Galveston County population projected at +43% by 2050 — long-run rental-demand tailwind backs the buy-and-hold thesis.
Negotiation context
- It's been on market 42 days — a 3% lower offer ($246k) is reasonable based on typical stale-listing flexibility.
- 5 sale attempts since 10y ago with the ask held roughly flat each time — persistent listings suggest the price (not the market) is what's stuck; bring a comps-based counter.
Risks & watch-outs
- Climate carrying-cost: severe wind risk, 99% chance of damaging wind over 30y; extreme-heat days projected 7→28/yr by 2055 (HVAC capex compounding) — expect insurance premiums to compound above CPI over the hold.
Questions for the listing agent
- What do current leases actually rent for vs. the listed asking? Can we see a recent rent roll and the last 12 months of T-12 income?
- It's been on market 42 days. Have you received any prior offers? Is the seller open to a 9% concession, seller financing, or rate buy-down credit?
- What does the HOA fee cover, when was the last increase, and are there any pending special assessments or reserve-fund shortfalls?
- Is there a deadline driving the sale (1031 exchange, divorce, estate, relocation)? That informs how much negotiation room exists.
- Schools are F-rated, which usually means shorter tenancies and higher turnover. Who's the typical renter profile here, and what's been the actual vacancy rate?
- Crime grade is F in this area — have there been break-ins, vandalism, or insurance claims at this property in the last 3 years? What carrier currently insures it and at what premium?
- The area grade is low — what's the realistic commute time and amenity access for the typical tenant pool here? Any planned neighborhood developments (good or bad) we should know about?
- What's the average days-on-market for RENTAL listings here right now (not sales)? A rising rental-DOM trend means longer vacancies and softer asking-rent achievability than the comps imply.
- What's the recent tenant-quality profile in this submarket — average credit score on applications, eviction rate, late-payment / NSF rate, and stable-employment percentage? A property-management company in the area should have these aggregated.
- How much new for-sale + rental construction is in the pipeline within 1–3 miles? Heavy new supply typically softens prices + rents 12–24 months out; constrained supply supports both.
Investment metrics
- 1% rule
- 0.91% ✗
- Cap rate
- 5.98%
- Cash-on-cash
- -1.11%
- DSCR
- 0.95
- GRM
- 9.1
CMA / ARV
- ARV (median comp)
- $250,766
- List price
- $254,000
- Delta
- 1.29%
- Verdict
- FAIR
- Comps
- 20 within 1.0 mi
Show comp detail 12 sales within ~0.75 mi
| Address | Dist | Beds/Ba | Sqft | Sold | Price | $/sf | Match |
|---|---|---|---|---|---|---|---|
| 109 Indigo Brush Dr | 0.09mi | 3/2.5 | 1,719 (0%) | 4mo | $235,000 | $137 | 93 |
| 12609 Pirate Bend Dr | 0.32mi | 3/2.0 | 1,720 (+0%) | 5mo | $265,000 | $154 | 79 |
| 2317 Nautica Terrace Dr | 0.44mi | 3/2.0 | 1,666 (-3%) | 1mo | $242,500 | $146 | 72 |
| 6 Prairie Oaks Dr | 0.28mi | 3/2.0 | 1,860 (+8%) | 4mo | $295,000 | $159 | 68 |
| 2315 Oyster Bay Ave | 0.45mi | 3/2.5 | 1,615 (-6%) | 3mo | $250,000 | $155 | 66 |
| 12801 Pirate Bend Dr | 0.26mi | 3/2.0 | 1,535 (-11%) | 4mo | $264,000 | $172 | 65 |
| 2210 Mirror Ridge Ct | 0.29mi | 4/2.0 (+1) | 1,831 (+6%) | 5mo | $299,990 | $164 | 64 |
| 13137 Leisure Cove Dr | 0.53mi | 4/2.5 (+1) | 1,785 (+4%) | 2mo | $309,900 | $174 | 62 |
| 2322 Nautica Terrace Dr | 0.46mi | 3/2.0 | 1,575 (-8%) | 1mo | $250,000 | $159 | 62 |
| 211 Hawks View Dr | 0.35mi | 4/2.0 (+1) | 1,875 (+9%) | 0mo | $267,500 | $143 | 61 |
| 2215 Manta Way | 0.47mi | 3/2.0 | 1,575 (-8%) | 1mo | $245,000 | $156 | 61 |
| 225 Splintered Arrow Dr | 0.27mi | 4/2.0 (+1) | 1,967 (+14%) | 3mo | $270,000 | $137 | 54 |
Match score weights: distance 35% · size 25% · config 20% · recency 20%. Top-matched comps best support the ARV.
Projected returns pro-forma
-3.0% appreciation · 3.95% rent growth · sell at horizon
- IRR
- -16.9%
- Equity multiple
- 0.40×
- Total profit
- $-43,010
- Equity at exit
- $37,872
- IRR
- -7.0%
- Equity multiple
- 0.54×
- Total profit
- $-33,031
- Equity at exit
- $21,961
Cash invested: $71,120 (down + closing). Projections, not guarantees.
Landlord ↔ Tenant lean methodology
- Overall (STATE)
- 87 Strongly Landlord-Friendly
- State Texas
- 87 Strongly Landlord-Friendly · R+5
- County
- — inherits STATE
- City
- — inherits STATE
ZIP-level market 77568
- Home prices YoY
- -22.7%
- Rents YoY
- 4.0%
- Active inventory
- 654
- Price-to-rent
- 9.1×
Monthly cashflow live
- Estimated rent
- $2,315 high interval (Pro) →
- Mortgage (P&I)
- −$1,332
- Tax from tax record
- −$428 /mo · $5,139/yr
- Insurance
- −$106
- HOA
- −$29
- Vacancy / Maint / Mgmt
- −$486
- Net cashflow
- $-66
Break-even live
UW: 25.0% down · 7.5% · 30yr · 1.5% tax · 5.0% vac · 8.0% maint · 8.0% mgmt
Financing live
Cash to close
- Down payment
- $63,500
- Closing costs
- $7,620
- Reserves months
- —
- Total cash needed
- —
Loan-product check · same deal, 3 products live
Conventional
25% down · 7.5% · 30yr
- Down + closing
- —
- Monthly P&I
- —
- Monthly cashflow
- —
- DSCR
- —
- Eligible?
- —
Personal DTI + credit; lowest rate.
DSCR
20% down · 8.5% · 30yr
- Down + closing
- —
- Monthly P&I
- —
- Monthly cashflow
- —
- DSCR
- —
- Eligible?
- —
No personal income docs; deal must DSCR.
Hard money
10% down · 12.0% · 12mo
- Down + closing
- —
- Monthly P&I
- —
- Monthly cashflow
- —
- DSCR
- —
- Eligible?
- —
Short-term bridge; refi at stabilization.
Rent comps 7 comps
| Address | Beds | Baths | Sqft | Rent | $/sqft | DOM | Units | Dist |
|---|---|---|---|---|---|---|---|---|
| 640 Totem Trail Dr La Marque, TX | 4.0 | 2.5 | 2134 | $2,309 | $1.08 | 11d | 1 | 0.16mi |
| 114 Mustang Stampede Dr La Marque, TX | 3.0 | 2.0 | 1752 | $2,050 | $1.17 | 1d | 1 | 0.40mi |
| 12524 Jetty Cv Santa Fe, TX | 3.0 | 2.0 | 1803 | $2,506 | $1.39 | 22d | 1 | 0.51mi |
| 2301 Starboard Sail Alta Loma, TX | 4.0 | 2.0 | 1856 | $2,181 | $1.18 | 11d | 1 | 0.59mi |
| 2437 Regatta Ln La Marque, TX | 4.0 | 2.0 | 1844 | $2,079 | $1.13 | 5d | 1 | 0.62mi |
| 3301 Gulf Fwy La Marque, TX | 1.0–3.0 | 1.0–2.0 | 991 | $2,430 | $2.45 | 2d | 22 | 1.00mi |
| 3210 Gulf Fwy Texas City, TX | 1.0–2.0 | 1.0–2.0 | 872 | $1,780 | $2.04 | 1d | 13 | 1.17mi |
HOA detail
- Monthly dues
- $29 · $348/yr
Listing history 30 events
-
2026-06-18days on market $254,000 Active 42 DOM
-
2026-06-17days on market $254,000 Active 41 DOM
-
2026-06-16days on market $254,000 Active 40 DOM
-
2026-06-15days on market $254,000 Active 39 DOM
-
2026-06-13days on market $254,000 Active 37 DOM
-
2026-06-09days on market $254,000 Active 33 DOM
-
2026-06-08days on market $254,000 Active 32 DOM
-
2026-06-07days on market $254,000 Active 31 DOM
-
2026-06-04days on market $254,000 Active 28 DOM
-
2026-06-03days on market $254,000 Active 27 DOM
-
2026-06-02days on market $254,000 Active 26 DOM
-
2026-06-01days on market $254,000 Active 25 DOM
-
2026-05-31days on market $254,000 Active 24 DOM
-
2026-05-07$254,000 Active 929-char remark
-
2024-07-22soldstatus
-
2024-07-19soldstatus Sold 590-char remark
Show marketing remark (590 chars)
This charming LGI property offers the spacious Colorado layout with 3 bedrooms and 2 1/2 bathrooms, totaling 1719 square feet of living space. Nestled in the desirable Painted Meadows neighborhood, this home was built in 2015 and boasts modern amenities and stylish finishes throughout including new flooring in the living room and all new carpet upstairs. Be eco-friendly and save money this summer with solar panels! Home includes built-in Taexx pest control system to keep the bugs away. Don't miss the opportunity to make this house your new home! Contact us today for more information.
-
2024-06-24status Pending 590-char remark
Show marketing remark (590 chars)
This charming LGI property offers the spacious Colorado layout with 3 bedrooms and 2 1/2 bathrooms, totaling 1719 square feet of living space. Nestled in the desirable Painted Meadows neighborhood, this home was built in 2015 and boasts modern amenities and stylish finishes throughout including new flooring in the living room and all new carpet upstairs. Be eco-friendly and save money this summer with solar panels! Home includes built-in Taexx pest control system to keep the bugs away. Don't miss the opportunity to make this house your new home! Contact us today for more information.
-
2024-06-16status Option Pending 590-char remark
Show marketing remark (590 chars)
This charming LGI property offers the spacious Colorado layout with 3 bedrooms and 2 1/2 bathrooms, totaling 1719 square feet of living space. Nestled in the desirable Painted Meadows neighborhood, this home was built in 2015 and boasts modern amenities and stylish finishes throughout including new flooring in the living room and all new carpet upstairs. Be eco-friendly and save money this summer with solar panels! Home includes built-in Taexx pest control system to keep the bugs away. Don't miss the opportunity to make this house your new home! Contact us today for more information.
-
2024-06-13$255,000 Active 590-char remark
Show marketing remark (590 chars)
This charming LGI property offers the spacious Colorado layout with 3 bedrooms and 2 1/2 bathrooms, totaling 1719 square feet of living space. Nestled in the desirable Painted Meadows neighborhood, this home was built in 2015 and boasts modern amenities and stylish finishes throughout including new flooring in the living room and all new carpet upstairs. Be eco-friendly and save money this summer with solar panels! Home includes built-in Taexx pest control system to keep the bugs away. Don't miss the opportunity to make this house your new home! Contact us today for more information.
-
2024-06-13historical
Show marketing remark (590 chars)
This charming LGI property offers the spacious Colorado layout with 3 bedrooms and 2 1/2 bathrooms, totaling 1719 square feet of living space. Nestled in the desirable Painted Meadows neighborhood, this home was built in 2015 and boasts modern amenities and stylish finishes throughout including new flooring in the living room and all new carpet upstairs. Be eco-friendly and save money this summer with solar panels! Home includes built-in Taexx pest control system to keep the bugs away. Don't miss the opportunity to make this house your new home! Contact us today for more information.
-
2024-05-03price $259,000
-
2024-04-04$265,000 Active
-
2020-09-09soldstatus
-
2020-08-31soldstatus Sold
-
2020-07-29status Pending
-
2020-07-20status Option Pending
-
2020-06-10$209,900 Active
-
2016-05-17soldstatus Sold
-
2016-04-12status Pending
-
2016-04-01$183,900 Active
ⓘ Source: listings_history table (triggers on properties + properties_extension) + one-shot
backfill from property_details.listing_events for pre-trigger history.
Tax reassessment forecast TX · Resets to sale price
- Current annual tax
- $5,139 · $428/mo
- Projected year-2 tax
- $5,139 · $428/mo
- Expected delta
- $0/yr ($0/mo · 0.0%)
ⓘ Screening estimate from a state-policy table — verify with the county assessor before closing.
Climate risk First Street
- Flood 3/10 Moderate FEMA zone X (unshaded) · 20% chance over 30 yrs
- Wildfire 4/10 Moderate
- Heat 10/10 Extreme 7 d/yr ≥110°F today · 28 d/yr by 30 yrs out
- Wind 9/10 Extreme 99% chance of damaging wind over 30 yrs
- Air quality 2/10 Low 1 unhealthy d/yr today · 1 by 30 yrs out
Nearby sold comps map
Loading sold comps map…
Walkable amenities ~0.75 mi
Loading nearby amenities…
Taxation est. · year 1
- Rental income
- $27,783
- − Mortgage interest
- −$14,228
- − Property taxes
- −$5,139
- − Insurance
- −$1,270
- − Repairs & maintenance
- −$2,223
- − Management
- −$2,223
- − HOA
- −$348
- − Depreciation
- −$7,389
- Taxable loss
- −$5,036
- Est. tax savings @ 24.0%
- +$1,209
- After-tax cash flow
- $416/yr
For passive investors: Depreciation is non-cash, so a rental often shows a tax loss while cash-flowing — sheltering income. Rental losses are passive: they offset passive income freely, and up to $25,000/yr can offset ordinary (W-2) income if you actively participate and your MAGI is under $100k (phasing out to $0 by $150k); unused losses carry forward. On sale, claimed depreciation is recaptured at up to 25%, and gains may owe capital-gains tax (a 1031 exchange can defer both). Figures are a year-1 estimate at your 24.0% rate — not tax advice; consult a CPA.
Schools (NCES district)
- District
- Santa Fe ISD
- NCES district ID
- 4839270
- Math proficiency
- 38% ▼ -10.00%
- Reading proficiency
- 39% ▼ -2.00%
- Median HH income
- $66,769
- Composite
- 34.86/100
- National rank
- #5091
- State rank
- #385 of 826 in TX
Livability — La Marque
- Score
- 59/100
- State rank
- #1136
- US rank
- #20037
Category grades
Schools grade is shown separately in the Schools card above.
Census & demographics
- Census place
- La Marque, TX
- County
- Galveston County · 357,330 people
- City population
- 23,083
- Metro
- Houston-The Woodlands-Sugar Land, TX
- Population (ZIP)
- 23,083
- Household income
- $74,694
- Rent vs Own
- Severe rent burden
- 700.0
Population outlook (Galveston County) Hauer SSP2
- Today (2025)
- 390,640 people
- By 2030
- 425,226 · +8.9%
- By 2040
- 493,765 · +26.4%
- By 2050
- 559,698 · +43.3%
- By 2075
- 719,260 · +84.1%
- By 2100
- 819,628 · +109.8%
Race, ethnicity, and origin ACS 2023
- Neighborhood character
- Highly diverse neighborhood (Simpson 0.71)
- Race & ethnicity
- White 37% Hispanic / Latino 29% Black 26% Two or more races 17% Asian 3%
- Hispanic origin (detail)
- Mexican 22% Puerto Rican 1%
- Common ancestry
- Lithuanian 1% Italian 1% Serbian 1%
- Foreign-born
- 8% · Canada
- Languages at home
- 77% English-only · Spanish 21% Tagalog/Filipino 1% Other Asian/Pacific 1%
Political lean MEDSL · Galveston
- 2024 margin
- Strong R (+27.4) · D 35.7% · R 63.1% · Other 1.2%
- 2008→2024 swing
- -7.9pp toward R · 2008: -19.5pp · 2024: -27.4pp
- All cycles
- 2024: R+27.4 2020: R+22.6 2016: R+22.6 2012: R+26.9 2008: R+19.5
Not yet ingested
- Civics
- —
Market trends
- HPI YoY
- ▼ -69.39%
- Current HPI
- 236.0239
- Rent YoY
- ▲ 3.95%
- Metro
- Houston-The Woodlands-Sugar Land, TX
- State GDP YoY
- ▲ 3.95%
- F500 in state
- 110
Industry mix (Fortune 500 HQ in TX)
| Industry | F500 HQs | Revenue |
|---|---|---|
| Energy | 16 | $1,198B |
|
||
| Technology | 5 | $198B |
|
||
| Engineering / Construction | 4 | $72B |
|
||
| Energy Services | 3 | $60B |
|
||
| Utilities | 3 | $41B |
|
||
| Healthcare | 2 | $330B |
|
||
Price history
+38.1% since first listed17 events — show timeline
- 2026-05-07 Listed $254,000 HARMLS
- 2024-07-22 Sold (Public Records) — Public Records
- 2024-07-19 Sold (MLS) — HARMLS
- 2024-06-24 Pending — HARMLS
- 2024-06-16 Pending — HARMLS
- 2024-06-13 Listing Removed — HARMLS
- 2024-06-13 Listed $255,000 HARMLS
- 2024-05-03 Price Changed $259,000 HARMLS
- 2024-04-04 Listed $265,000 HARMLS
- 2020-09-09 Sold (Public Records) — Public Records
- 2020-08-31 Sold (MLS) — HARMLS
- 2020-07-29 Pending — HARMLS
- 2020-07-20 Pending — HARMLS
- 2020-06-10 Listed $209,900 HARMLS
- 2016-05-17 Sold (MLS) — HARMLS
- 2016-04-12 Pending — HARMLS
- 2016-04-01 Listed $183,900 HARMLS
Property tax history
+22.3%/yrLatest (2025): $5,139 · -5.3% YoY. Source: county tax records.
Cash-flow waterfall
monthlySold comps — $/sqft
last 12 mo · ≤1 miLoading sold comps…