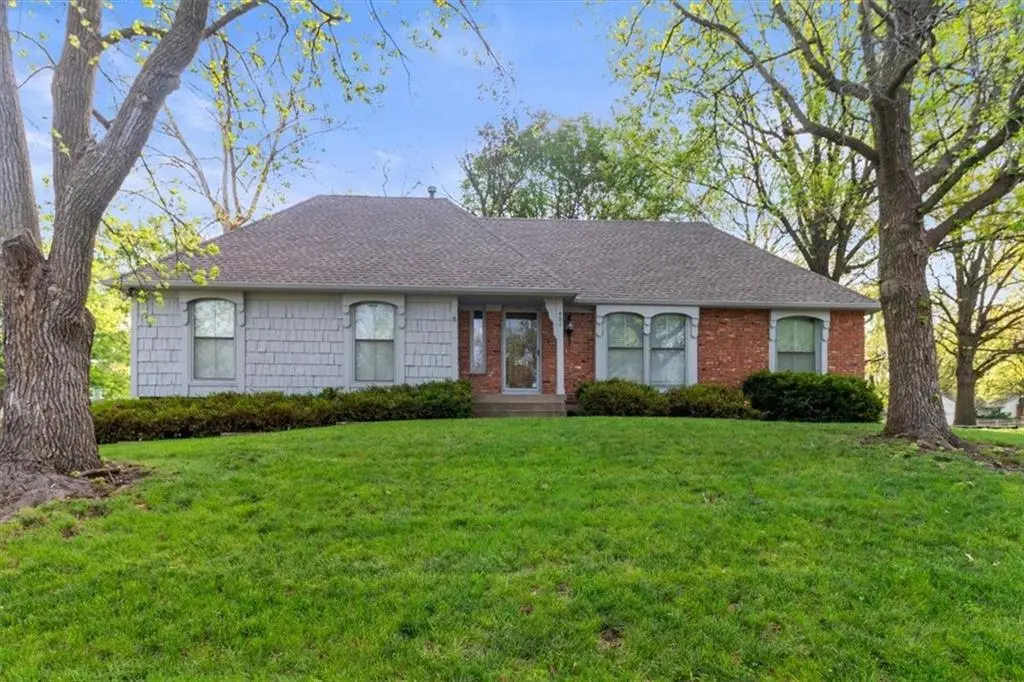
401 S Sunset Ln
Raymore, MO 64083
$300,000D+
4 bd · 3.0 ba ·
2,826 sqft ·
Built 1977
· SingleFamily
· Pending
· 4 DOM
Cashflow @ list (25.0% down · 7.5%)
Estimated rent
$2,466/mo
Mortgage (P&I)
−$1,573
Tax + insurance
−$444
HOA
−$0
Vac / Maint / Mgmt
−$518
Net cashflow
$-70/mo
Annual
$-835/yr
Cap rate
6.01%
Cash-on-cash
-0.99%
DSCR
0.96
1% rule
0.82%
Cash to close
$84,000
Investor read
- This is a 4-bed/3.0-bath single-family listed at $300k.
- At list price, monthly cash flow is $-70 ($-835/yr) — negative.
- To cash-flow at today's rent, offer at most $288k (4.1% below list).
- To meet the 1% rule (rent ≥ 1% of price), the offer needs to be $247k (17.8% below list).
- Only 4 days on market — expect competitive offers; lowballing is unlikely to land.
- Recommended offer: $247k (17.8% below list) — sets the bar for 1% rule.
- Local home prices are declining (-3.0%/yr); year-one equity from $2k of loan paydown is wiped out by about $9k of value loss. Plan a longer hold.
- Location reads 71/100 on livability (#111 in MO) — a middle-class / working-renter tenant base. Strengths: employment A+, housing A+, crime A; Watch: amenities F, commute F, health & safety F.
- Raymore-Peculiar R-II (suburban): math 37% / reading 51% proficiency, ranked #70 of 324 in MO (top 22%) — families likely to look elsewhere, expect single-tenant / working-renter base with shorter leases.
- Market conditions: Rents rising fast (+4.6%/yr); 352 active listings in the ZIP; 3 comparable units currently listed for rent nearby; rentals at typical pace (median 15d on market — plan ~3-4 weeks tenant-placement turnaround); solid renter incomes; 588 units permitted in Cass County in 2024 (0 in 5+ unit buildings).
- Cass County population projected to shrink 3% by 2050 — rents likely to lag national; underwrite the cash flow, not the appreciation.
- Cap rate 6.0% vs local median 3.2% in Raymore — top-decile yield for the area; either an underpriced asset or a hidden risk that comps aren't pricing in. Stress-test before assuming the spread holds.
Questions for listing agent
- What do current leases actually rent for vs. the listed asking? Can we see a recent rent roll and the last 12 months of T-12 income?
- Built in 1977 — when were the roof, HVAC, electrical panel, plumbing, and water heater last replaced?
- Is there a deadline driving the sale (1031 exchange, divorce, estate, relocation)? That informs how much negotiation room exists.
- Schools are B-rated — typically a magnet for longer-tenancy family renters. What's the average tenant stay here, and is there a school-zone premium baked into asking?
- The area grade is low — what's the realistic commute time and amenity access for the typical tenant pool here? Any planned neighborhood developments (good or bad) we should know about?
- What's the average days-on-market for RENTAL listings here right now (not sales)? A rising rental-DOM trend means longer vacancies and softer asking-rent achievability than the comps imply.
- What's the recent tenant-quality profile in this submarket — average credit score on applications, eviction rate, late-payment / NSF rate, and stable-employment percentage? A property-management company in the area should have these aggregated.
- How much new for-sale + rental construction is in the pipeline within 1–3 miles? Heavy new supply typically softens prices + rents 12–24 months out; constrained supply supports both.
CashFlowRE · CFR-1JT3VSF4PSM836
· Data 3 weeks ago
cashflowre.app · 2026-05-29