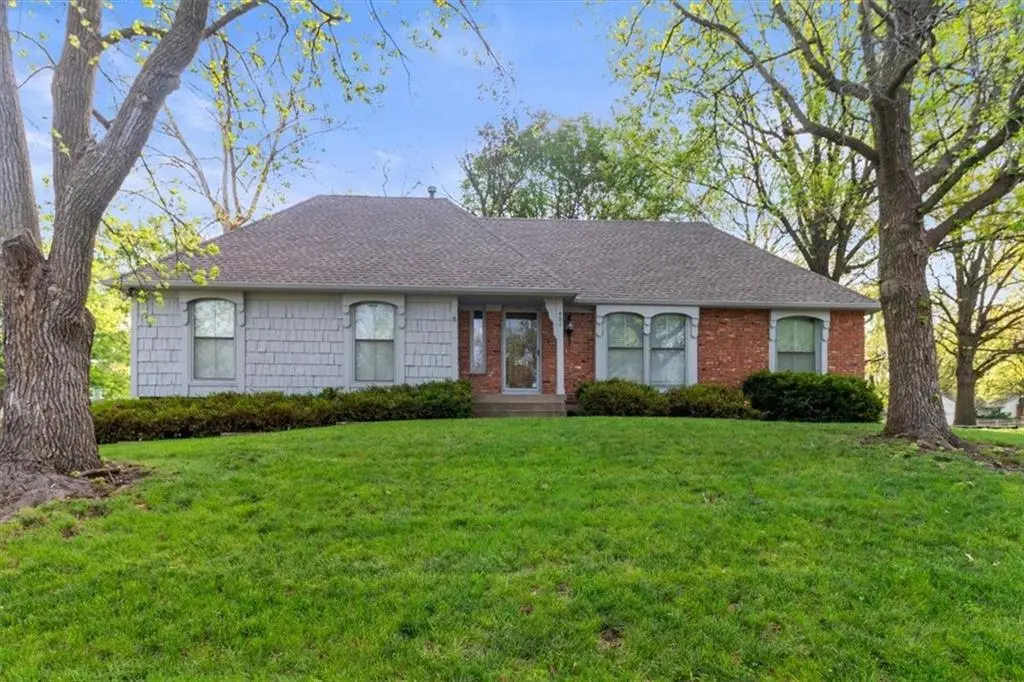
401 S Sunset Ln · Raymore, MO
Flood risk 1/10 · Minimal
- FEMA flood zone
- X (unshaded)
- Chance of flooding over 30 yrs
- 0.0%
- Est. flood insurance / yr
- $473 – $860
Fire risk 2/10 · Minimal
- Est. fire insurance / yr
- $1,054 – $1,958
Heat risk 3/10 · Minor
- Hot days now (above 107°F)
- 7 days/yr
- Hot days in 30 yrs
- 16 days/yr
Wind risk 2/10 · Minimal
- Chance of severe wind over 30 yrs
- —
Air-quality risk 2/10 · Minimal
- Unhealthy air days now
- 2 days/yr
- Unhealthy air days in 30 yrs
- 2 days/yr
Risk factors via First Street. Map © Google.
Why this score? — see what drove the D+ grade
The composite is a weighted blend of 9 inputs, each scored 0–100. Each bar is that input's sub-score; the figure is the points it added to the 100-point composite (weight × sub-score).
- ARV discount +15.0/15.0
- Cash flow +12.0/30.0
- Schools +4.0/10.0
- DSCR +3.6/10.0
- Rent growth +3.6/5.0
- Livability +3.6/5.0
- 1% rule +3.2/10.0
- Condition / age +2.5/5.0
- Appreciation +0.0/10.0
$300,000
🖨 Deal sheet 📄 Offer letter ✓ Due diligence
Listing remarks
This 4 bedroom, 3 bathroom home offers the kind of space that’s getting harder to find, with room to spread out both upstairs and down. The partially finished basement gives you flexibility—whether you’re thinking extra living space, a rec room, or just need a little breathing room for storage and hobbies. Out back, you’ve got the peace and quiet Raymore is known for, and a 2-car garage that gives you plenty of space for vehicles, tools, or weekend projects. It needs a little love, but for the right buyer, that means the chance to build equity, make it your own, and turn it into something special.
Key facts
- 0.35 acre lot
- 2 garage spots
- Built 1977
Neighborhood map
What this means for you Summary
Snapshot
- This is a 4-bed/3.0-bath single-family listed at $300k.
Deal economics
- At list price, monthly cash flow is $-70 ($-835/yr) — negative.
- To cash-flow at today's rent, offer at most $288k (4.1% below list).
- To meet the 1% rule (rent ≥ 1% of price), the offer needs to be $247k (17.8% below list).
- Recommended offer: $247k (17.8% below list) — sets the bar for 1% rule.
- Cap rate 6.0% vs local median 3.2% in Raymore — top-decile yield for the area; either an underpriced asset or a hidden risk that comps aren't pricing in. Stress-test before assuming the spread holds.
Location & tenants
- Location reads 71/100 on livability (#111 in MO) — a middle-class / working-renter tenant base. Strengths: employment A+, housing A+, crime A; Watch: amenities F, commute F, health & safety F.
- Raymore-Peculiar R-II (suburban): math 37% / reading 51% proficiency, ranked #70 of 324 in MO (top 22%) — families likely to look elsewhere, expect single-tenant / working-renter base with shorter leases.
- Market conditions: Rents rising fast (+4.6%/yr); 352 active listings in the ZIP; 3 comparable units currently listed for rent nearby; rentals at typical pace (median 15d on market — plan ~3-4 weeks tenant-placement turnaround); solid renter incomes; 588 units permitted in Cass County in 2024 (0 in 5+ unit buildings).
Forward outlook
- Local home prices are declining (-3.0%/yr); year-one equity from $2k of loan paydown is wiped out by about $9k of value loss. Plan a longer hold.
- Cass County population projected to shrink 3% by 2050 — rents likely to lag national; underwrite the cash flow, not the appreciation.
Negotiation context
- Only 4 days on market — expect competitive offers; lowballing is unlikely to land.
Questions for the listing agent
- What do current leases actually rent for vs. the listed asking? Can we see a recent rent roll and the last 12 months of T-12 income?
- Built in 1977 — when were the roof, HVAC, electrical panel, plumbing, and water heater last replaced?
- Is there a deadline driving the sale (1031 exchange, divorce, estate, relocation)? That informs how much negotiation room exists.
- Schools are B-rated — typically a magnet for longer-tenancy family renters. What's the average tenant stay here, and is there a school-zone premium baked into asking?
- The area grade is low — what's the realistic commute time and amenity access for the typical tenant pool here? Any planned neighborhood developments (good or bad) we should know about?
- What's the average days-on-market for RENTAL listings here right now (not sales)? A rising rental-DOM trend means longer vacancies and softer asking-rent achievability than the comps imply.
- What's the recent tenant-quality profile in this submarket — average credit score on applications, eviction rate, late-payment / NSF rate, and stable-employment percentage? A property-management company in the area should have these aggregated.
- How much new for-sale + rental construction is in the pipeline within 1–3 miles? Heavy new supply typically softens prices + rents 12–24 months out; constrained supply supports both.
Investment metrics
- 1% rule
- 0.82% ✗
- Cap rate
- 6.01%
- Cash-on-cash
- -0.99%
- DSCR
- 0.96
- GRM
- 10.1
CMA / ARV
- ARV (on-the-fly)
- $381,510
- Comps found
- 12
Show comp detail 12 sales within ~0.75 mi
| Address | Dist | Beds/Ba | Sqft | Sold | Price | $/sf | Match |
|---|---|---|---|---|---|---|---|
| 401 S Sunset Ln | 0.00mi | 4/3.0 | 2,800 (-1%) | 1mo | $300,000 | $107 | 98 |
| 615 Overlook Dr | 0.08mi | 4/3.0 | 3,028 (+7%) | 1mo | $425,000 | $140 | 84 |
| 109 N Eastglen Dr | 0.65mi | 4/3.0 | 2,800 (-1%) | 6mo | $435,000 | $155 | 63 |
| 1100 Johnston Dr | 0.56mi | 3/3.0 (-1) | 2,897 (+2%) | 5mo | $360,000 | $124 | 61 |
| 709 Derby St | 0.57mi | 3/2.5 (-1) | 2,716 (-4%) | 1mo | $350,000 | $129 | 59 |
| 1300 Aberdeen Cir | 0.70mi | 4/3.0 | 3,040 (+8%) | 0mo | $529,900 | $174 | 54 |
| 610 Roanke Dr | 0.72mi | 4/2.5 | 2,966 (+5%) | 6mo | $399,000 | $135 | 51 |
| 208 N Pacific Ct | 0.52mi | 4/3.0 | 3,232 (+14%) | 2mo | $395,000 | $122 | 50 |
| 105 N Landcaster Dr | 0.48mi | 3/3.0 (-1) | 2,455 (-13%) | 1mo | $240,000 | $98 | 50 |
| 102 Johnston Pkwy | 0.44mi | 3/2.5 (-1) | 2,439 (-14%) | 6mo | $240,000 | $98 | 45 |
| 105 N Eastglen Dr | 0.65mi | 4/3.0 | 2,485 (-12%) | 6mo | $435,000 | $175 | 44 |
| 112 S Westglen Dr | 0.74mi | 4/3.5 | 2,500 (-12%) | 4mo | $409,900 | $164 | 41 |
Match score weights: distance 35% · size 25% · config 20% · recency 20%. Top-matched comps best support the ARV.
Projected returns pro-forma
-3.0% appreciation · 4.56% rent growth · sell at horizon
- IRR
- -16.2%
- Equity multiple
- 0.42×
- Total profit
- $-49,108
- Equity at exit
- $44,731
- IRR
- -5.5%
- Equity multiple
- 0.62×
- Total profit
- $-31,802
- Equity at exit
- $25,939
Cash invested: $84,000 (down + closing). Projections, not guarantees.
Landlord ↔ Tenant lean methodology
- Overall (STATE)
- 81 Strongly Landlord-Friendly
- State Missouri
- 81 Strongly Landlord-Friendly · R+10
- County
- — inherits STATE
- City
- — inherits STATE
ZIP-level market 64083
- Rents YoY
- 4.6%
- Active inventory
- 352
- Price-to-rent
- 10.1×
Monthly cashflow live
- Estimated rent
- $2,466 medium interval (Pro) →
- Mortgage (P&I)
- −$1,573
- Tax from tax record
- −$319 /mo · $3,833/yr
- Insurance
- −$125
- HOA
- −$0
- Vacancy / Maint / Mgmt
- −$518
- Net cashflow
- $-70
Break-even live
UW: 25.0% down · 7.5% · 30yr · 1.5% tax · 5.0% vac · 8.0% maint · 8.0% mgmt
Financing live
Cash to close
- Down payment
- $75,000
- Closing costs
- $9,000
- Reserves months
- —
- Total cash needed
- —
Loan-product check · same deal, 3 products live
Conventional
25% down · 7.5% · 30yr
- Down + closing
- —
- Monthly P&I
- —
- Monthly cashflow
- —
- DSCR
- —
- Eligible?
- —
Personal DTI + credit; lowest rate.
DSCR
20% down · 8.5% · 30yr
- Down + closing
- —
- Monthly P&I
- —
- Monthly cashflow
- —
- DSCR
- —
- Eligible?
- —
No personal income docs; deal must DSCR.
Hard money
10% down · 12.0% · 12mo
- Down + closing
- —
- Monthly P&I
- —
- Monthly cashflow
- —
- DSCR
- —
- Eligible?
- —
Short-term bridge; refi at stabilization.
Rent comps 3 comps
| Address | Beds | Baths | Sqft | Rent | $/sqft | DOM | Units | Dist |
|---|---|---|---|---|---|---|---|---|
| 109 E Pine St Unit 111 Raymore, MO | 3.0 | 3.0 | 1987 | $2,295 | $1.16 | 23d | 1 | 0.94mi |
| 1710 Black Bear Ct Raymore, MO | 4.0 | 3.0 | 2566 | $2,495 | $0.97 | 14d | 1 | 1.31mi |
| 208 S Darrowby Dr Raymore, MO | 3.0 | 2.0 | 2220 | $2,036 | $0.92 | 7d | 1 | 1.35mi |
Listing history 3 events
-
2026-04-27status Pending
-
2026-04-24$300,000 Active
-
2026-04-21historical $300,000
ⓘ Source: listings_history table (triggers on properties + properties_extension) + one-shot
backfill from property_details.listing_events for pre-trigger history.
Tax reassessment forecast MO · Resets to sale price
- Current annual tax
- $3,833 · $319/mo
- Projected year-2 tax
- $3,833 · $319/mo
- Expected delta
- $0/yr ($0/mo · 0.0%)
ⓘ Screening estimate from a state-policy table — verify with the county assessor before closing.
Climate risk First Street
- Flood 1/10 Low FEMA zone X (unshaded) · 0% chance over 30 yrs
- Wildfire 2/10 Low
- Heat 3/10 Moderate 7 d/yr ≥107°F today · 16 d/yr by 30 yrs out
- Wind 2/10 Low
- Air quality 2/10 Low 2 unhealthy d/yr today · 2 by 30 yrs out
Nearby sold comps map
Loading sold comps map…
Walkable amenities ~0.75 mi
Loading nearby amenities…
Taxation est. · year 1
- Rental income
- $29,592
- − Mortgage interest
- −$16,805
- − Property taxes
- −$3,833
- − Insurance
- −$1,500
- − Repairs & maintenance
- −$2,367
- − Management
- −$2,367
- − Depreciation
- −$8,727
- Taxable loss
- −$6,008
- Est. tax savings @ 24.0%
- +$1,442
- After-tax cash flow
- $607/yr
For passive investors: Depreciation is non-cash, so a rental often shows a tax loss while cash-flowing — sheltering income. Rental losses are passive: they offset passive income freely, and up to $25,000/yr can offset ordinary (W-2) income if you actively participate and your MAGI is under $100k (phasing out to $0 by $150k); unused losses carry forward. On sale, claimed depreciation is recaptured at up to 25%, and gains may owe capital-gains tax (a 1031 exchange can defer both). Figures are a year-1 estimate at your 24.0% rate — not tax advice; consult a CPA.
Schools (NCES district)
- District
- Raymore-Peculiar R-II
- NCES district ID
- 2923730
- Math proficiency
- 37% ▼ -10.00%
- Reading proficiency
- 51% ▼ -5.00%
- Median HH income
- $71,939
- Composite
- 39.86/100
- National rank
- #3865
- State rank
- #70 of 324 in MO
Livability — Raymore
- Score
- 71/100
- State rank
- #111
- US rank
- #7062
Category grades
Schools grade is shown separately in the Schools card above.
Census & demographics
- Census place
- Raymore, MO
- County
- Cass County · 65,358 people
- City population
- 26,201
- Metro
- Kansas City, MO-KS
- Population (ZIP)
- 26,201
- Household income
- $101,667
- Rent vs Own
- Severe rent burden
- 488.0
Population outlook (Cass County) Hauer SSP2
- Today (2025)
- 105,292 people
- By 2030
- 106,109 · +0.8%
- By 2040
- 105,786 · +0.5%
- By 2050
- 102,062 · -3.1%
- By 2075
- 88,569 · -15.9%
- By 2100
- 68,293 · -35.1%
Race, ethnicity, and origin ACS 2023
- Neighborhood character
- Predominantly White (78%)
- Race & ethnicity
- White 78% Two or more races 10% Black 9% Hispanic / Latino 6% Asian 1%
- Hispanic origin (detail)
- Mexican 2%
- Common ancestry
- Romanian 4% Italian 3% Serbian 2%
- Foreign-born
- 2% · Canada
- Languages at home
- 97% English-only · Spanish 1% Tagalog/Filipino 1%
Political lean MEDSL · Cass
- 2024 margin
- Solid R (+32.1) · D 33.3% · R 65.4% · Other 1.3%
- 2008→2024 swing
- -12.5pp toward R · 2008: -19.6pp · 2024: -32.1pp
- All cycles
- 2024: R+32.1 2020: R+31.6 2016: R+35.9 2012: R+28.4 2008: R+19.6
Not yet ingested
- Civics
- —
Market trends
- HPI YoY
- ▼ -211.98%
- Current HPI
- 181.1129
- Rent YoY
- ▲ 4.56%
- Metro
- Kansas City, MO-KS
- State GDP YoY
- ▲ 1.84%
- F500 in state
- 20
Industry mix (Fortune 500 HQ in MO)
| Industry | F500 HQs | Revenue |
|---|---|---|
| Healthcare | 1 | $163B |
|
||
| Insurance | 1 | $21B |
|
||
| Industrial Technology | 1 | $17B |
|
||
| Retail | 1 | $16B |
|
||
| Industrial Distribution | 1 | $10B |
|
||
| Utilities | 1 | $9B |
|
||
Price history
+0.0% since first listed3 events — show timeline
- 2026-04-27 Pending — Heartland MLS as Distributed by MLS Grid
- 2026-04-24 Listed $300,000 Heartland MLS as Distributed by MLS Grid
- 2026-04-21 Coming Soon $300,000 Heartland MLS as Distributed by MLS Grid
Property tax history
+4.2%/yrLatest (2025): $3,833 · +13.0% YoY. Source: county tax records.
Cash-flow waterfall
monthlySold comps — $/sqft
last 12 mo · ≤1 miLoading sold comps…