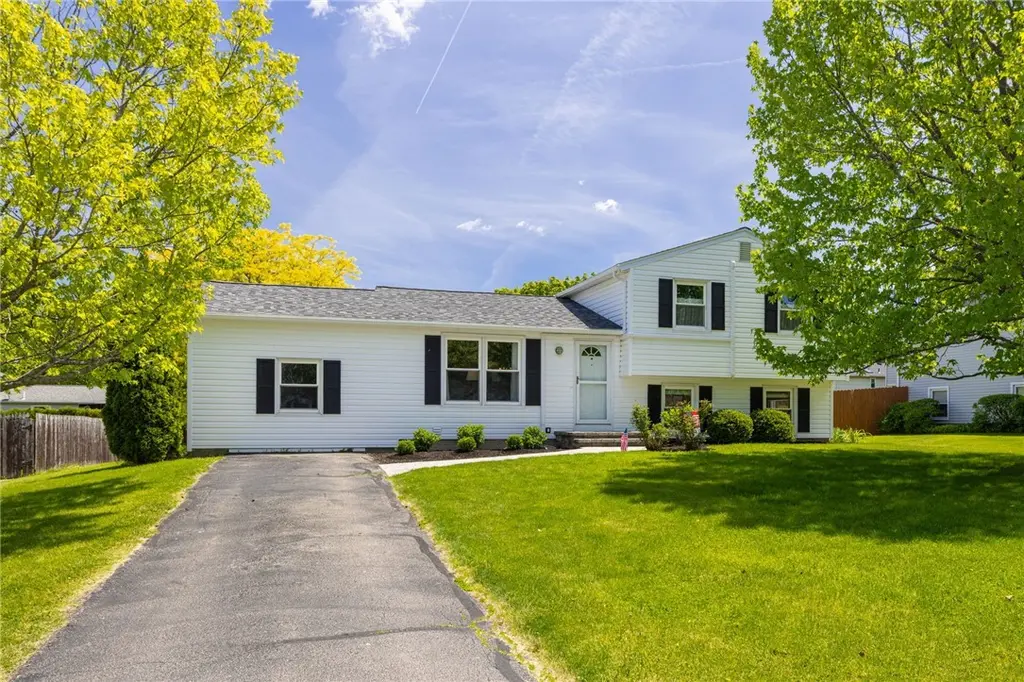
1739 Birchwood Dr
Canandaigua, NY 14425
$299,900D
3 bd · 1.5 ba ·
1,882 sqft ·
Built 1982
· SingleFamily
· Active
· 17 DOM
Cashflow @ list (25.0% down · 7.5%)
Estimated rent
$2,720/mo
Mortgage (P&I)
−$1,573
Tax + insurance
−$713
HOA
−$0
Vac / Maint / Mgmt
−$571
Net cashflow
$-137/mo
Annual
$-1,644/yr
Cap rate
5.74%
Cash-on-cash
-1.96%
DSCR
0.91
1% rule
0.91%
Cash to close
$83,972
Investor read
- This is a 3-bed/1.5-bath single-family listed at $300k.
- At list price, monthly cash flow is $-137 ($-2k/yr) — negative.
- To cash-flow at today's rent, offer at most $276k (8.1% below list).
- To meet the 1% rule (rent ≥ 1% of price), the offer needs to be $272k (9.3% below list).
- It's been on market 17 days — a 2% lower offer ($295k) is reasonable based on typical stale-listing flexibility.
- Recommended offer: $272k (9.3% below list) — sets the bar for 1% rule.
- Local home prices are declining (-3.0%/yr); year-one equity from $2k of loan paydown is wiped out by about $9k of value loss. Plan a longer hold.
- Location reads 75/100 on livability (#243 in NY, #3,822 nationally) — a middle-class / working-renter tenant base. Strengths: commute A+, housing A+, cost of living B; Watch: employment C-, amenities F, health & safety D-.
- Canandaigua City School District (suburban): math 50% / reading 59% proficiency, ranked #305 of 590 in NY (top 52%) — acceptable for families but not a draw, mixed tenant base, ~2y average lease.
- Zoned schools: Canandaigua Primary-Elementary School (math 37% / reading 49%, grade F, #1,354 of 2,108 statewide, top 64%, 1,475 students, 41% FRL); Canandaigua Middle School (math 38% / reading 55%, grade D+, #330 of 729 statewide, top 46%, 676 students, 0% FRL); Canandaigua Academy (math 100% / reading 92%, grade A+, #71 of 1,100 statewide, top 7%, 1,082 students, 36% FRL) — zoned schools at 26% FRL track the district average.
- Market conditions: 73 active listings in the ZIP; 3 comparable units currently listed for rent nearby; rentals leasing fast (median 5d on market — plan ~1-2 weeks tenant-placement turnaround); solid renter incomes; 284 units permitted in Ontario County in 2024 (69 in 5+ unit buildings).
- Ontario County population projected to shrink 6% by 2050 — rents likely to lag national; underwrite the cash flow, not the appreciation.
- Cap rate 5.7% vs local median 3.3% in Canandaigua — top-decile yield for the area; either an underpriced asset or a hidden risk that comps aren't pricing in. Stress-test before assuming the spread holds.
- This rent runs 35% of the median local income ($95k/yr) — at the standard rent-burdened threshold; future hikes will face affordability resistance.
Questions for listing agent
- What do current leases actually rent for vs. the listed asking? Can we see a recent rent roll and the last 12 months of T-12 income?
- Is there a deadline driving the sale (1031 exchange, divorce, estate, relocation)? That informs how much negotiation room exists.
- Schools are B-rated — typically a magnet for longer-tenancy family renters. What's the average tenant stay here, and is there a school-zone premium baked into asking?
- The area grade is low — what's the realistic commute time and amenity access for the typical tenant pool here? Any planned neighborhood developments (good or bad) we should know about?
- What's the average days-on-market for RENTAL listings here right now (not sales)? A rising rental-DOM trend means longer vacancies and softer asking-rent achievability than the comps imply.
- What's the recent tenant-quality profile in this submarket — average credit score on applications, eviction rate, late-payment / NSF rate, and stable-employment percentage? A property-management company in the area should have these aggregated.
- How much new for-sale + rental construction is in the pipeline within 1–3 miles? Heavy new supply typically softens prices + rents 12–24 months out; constrained supply supports both.
CashFlowRE · CFR-1JX8XE56PGPJTZ
· Data 12 h ago
cashflowre.app · 2026-05-29