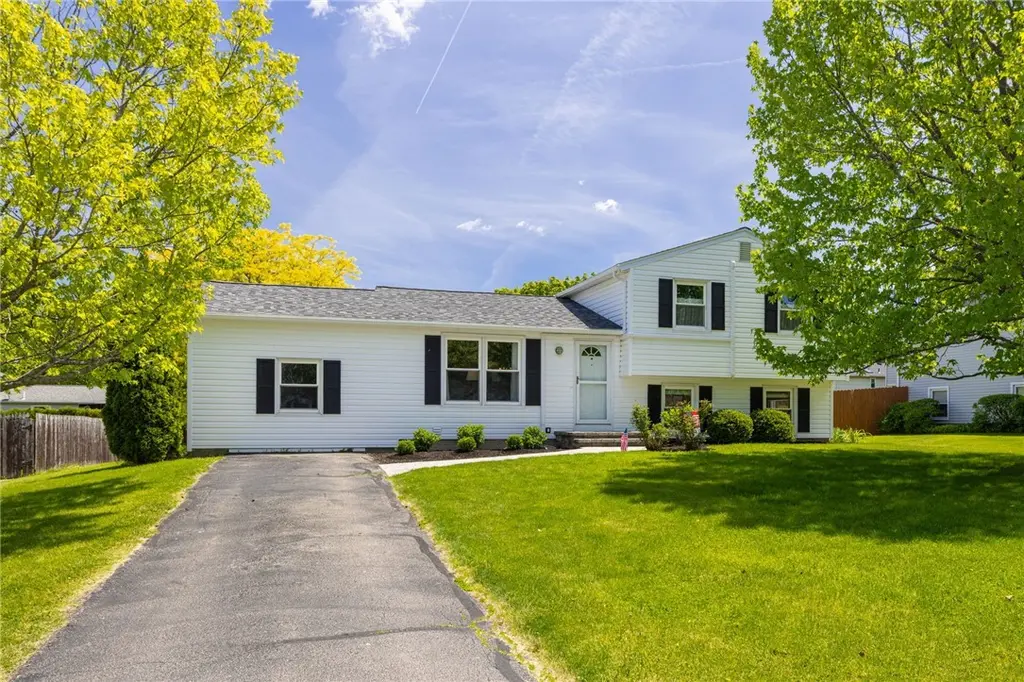
1739 Birchwood Dr · Canandaigua, NY
Flood risk 1/10 · Minimal
- FEMA flood zone
- X
- Chance of flooding over 30 yrs
- 0.0%
- Est. flood insurance / yr
- $473 – $860
Fire risk 2/10 · Minimal
- Est. fire insurance / yr
- $691 – $1,283
Heat risk 2/10 · Minimal
- Hot days now (above 95°F)
- 7 days/yr
- Hot days in 30 yrs
- 16 days/yr
Wind risk 1/10 · Minimal
- Chance of severe wind over 30 yrs
- —
Air-quality risk 2/10 · Minimal
- Unhealthy air days now
- 0 days/yr
- Unhealthy air days in 30 yrs
- 1 days/yr
Risk factors via First Street. Map © Google.
Why this score? — see what drove the D grade
The composite is a weighted blend of 9 inputs, each scored 0–100. Each bar is that input's sub-score; the figure is the points it added to the 100-point composite (weight × sub-score).
- Cash flow +10.8/30.0
- ARV discount +10.6/15.0
- Schools +4.7/10.0
- 1% rule +4.1/10.0
- Livability +3.8/5.0
- DSCR +3.1/10.0
- Rent growth +2.5/5.0
- Condition / age +2.5/5.0
- Appreciation +0.0/10.0
$299,900
🖨 Deal sheet (PDF) 📄 Offer letter ✓ Due diligence
Listing remarks
Nestled in a quiet, low-traffic neighborhood within the highly sought-after Farmington/Canandaigua School District, this is the kind of home you don't find every day. Cherished by the same proud owners for over 43 years, the love and care poured into every detail speaks for itself the moment you arrive. Fantastic curb appeal greets you with meticulously maintained landscaping, a welcoming front walk way & a brand-new tear-off roof 2024. Step inside to a bright, open-concept main living space featuring luxury vinyl plank flooring and fresh paint throughout. The living room flows effortlessly into the beautifully updated kitchen with new modern white cabinets, sleek contemporary counter
Key facts
- 0.23 acre lot
- Built 1982
- Listed 17 days
Property features AI
Exterior
- Parking: No garage
- Utilities: High-speed internet available; Public water (connected); Sewer connected
- Home design: Single-story home; Vinyl siding; Resale property
- Construction: Block foundation; Vinyl siding exterior
- Exterior features: Blacktop driveway; Deck; Partial fencing; Shed(s) / storage
Interior
- Kitchen: Dishwasher; Electric oven; Electric range; Microwave; Refrigerator
- Bedrooms: One main-level bedroom
- Flooring: Carpet; Luxury vinyl; Tile; Varied flooring
- Bathrooms: One full bathroom; One half bathroom; One main-level bathroom
- Heating & cooling: Heat pump; Electric heating; Forced air; Central air
- Interior features: Ceiling fans; Eat-in kitchen; Separate/formal living room; Kitchen-family room combo; Living-dining room; Full finished basement with sump pump; 7 total rooms; Basement level laundry
- Laundry & utility: Laundry in basement; Electric water heater
Neighborhood map
What this means for you Summary
Snapshot
- This is a 3-bed/1.5-bath single-family listed at $300k.
Deal economics
- At list price, monthly cash flow is $-137 ($-2k/yr) — negative.
- To cash-flow at today's rent, offer at most $276k (8.1% below list).
- To meet the 1% rule (rent ≥ 1% of price), the offer needs to be $272k (9.3% below list).
- Recommended offer: $272k (9.3% below list) — sets the bar for 1% rule.
- Cap rate 5.7% vs local median 3.3% in Canandaigua — top-decile yield for the area; either an underpriced asset or a hidden risk that comps aren't pricing in. Stress-test before assuming the spread holds.
Location & tenants
- Location reads 75/100 on livability (#243 in NY, #3,822 nationally) — a middle-class / working-renter tenant base. Strengths: commute A+, housing A+, cost of living B; Watch: employment C-, amenities F, health & safety D-.
- Canandaigua City School District (suburban): math 50% / reading 59% proficiency, ranked #305 of 590 in NY (top 52%) — acceptable for families but not a draw, mixed tenant base, ~2y average lease.
- Zoned schools: Canandaigua Primary-Elementary School (math 37% / reading 49%, grade F, #1,354 of 2,108 statewide, top 64%, 1,475 students, 41% FRL); Canandaigua Middle School (math 38% / reading 55%, grade D+, #330 of 729 statewide, top 46%, 676 students, 0% FRL); Canandaigua Academy (math 100% / reading 92%, grade A+, #71 of 1,100 statewide, top 7%, 1,082 students, 36% FRL) — zoned schools at 26% FRL track the district average.
- Market conditions: 73 active listings in the ZIP; 3 comparable units currently listed for rent nearby; rentals leasing fast (median 5d on market — plan ~1-2 weeks tenant-placement turnaround); solid renter incomes; 284 units permitted in Ontario County in 2024 (69 in 5+ unit buildings).
- This rent runs 35% of the median local income ($95k/yr) — at the standard rent-burdened threshold; future hikes will face affordability resistance.
Forward outlook
- Local home prices are declining (-3.0%/yr); year-one equity from $2k of loan paydown is wiped out by about $9k of value loss. Plan a longer hold.
- Ontario County population projected to shrink 6% by 2050 — rents likely to lag national; underwrite the cash flow, not the appreciation.
Negotiation context
- It's been on market 17 days — a 2% lower offer ($295k) is reasonable based on typical stale-listing flexibility.
Questions for the listing agent
- What do current leases actually rent for vs. the listed asking? Can we see a recent rent roll and the last 12 months of T-12 income?
- Is there a deadline driving the sale (1031 exchange, divorce, estate, relocation)? That informs how much negotiation room exists.
- Schools are B-rated — typically a magnet for longer-tenancy family renters. What's the average tenant stay here, and is there a school-zone premium baked into asking?
- The area grade is low — what's the realistic commute time and amenity access for the typical tenant pool here? Any planned neighborhood developments (good or bad) we should know about?
- What's the average days-on-market for RENTAL listings here right now (not sales)? A rising rental-DOM trend means longer vacancies and softer asking-rent achievability than the comps imply.
- What's the recent tenant-quality profile in this submarket — average credit score on applications, eviction rate, late-payment / NSF rate, and stable-employment percentage? A property-management company in the area should have these aggregated.
- How much new for-sale + rental construction is in the pipeline within 1–3 miles? Heavy new supply typically softens prices + rents 12–24 months out; constrained supply supports both.
Investment metrics
- 1% rule
- 0.91% ✗
- Cap rate
- 5.74%
- Cash-on-cash
- -1.96%
- DSCR
- 0.91
- GRM
- 9.2
CMA / ARV
- ARV (on-the-fly)
- $321,822
- Comps found
- 10
Show comp detail 10 sales within ~0.75 mi
| Address | Dist | Beds/Ba | Sqft | Sold | Price | $/sf | Match |
|---|---|---|---|---|---|---|---|
| 5838 Walnut Dr | 0.13mi | 4/1.5 (+1) | 1,820 (-3%) | 6mo | $350,000 | $192 | 78 |
| 5788 Mountain Ash Dr | 0.27mi | 3/1.5 | 1,902 (+1%) | 18mo | $255,000 | $134 | 71 |
| 1757 Beechwood Dr | 0.08mi | 4/2.0 (+1) | 1,768 (-6%) | 14mo | $320,000 | $181 | 68 |
| 1753 Maplewood Dr | 0.21mi | 4/2.0 (+1) | 2,100 (+12%) | 1mo | $269,500 | $128 | 63 |
| 1612 Wheatstone Dr | 0.54mi | 3/1.5 | 1,800 (-4%) | 8mo | $250,000 | $139 | 61 |
| 1844 Saddle Horn Dr | 0.28mi | 3/2.5 | 2,057 (+9%) | 11mo | $352,000 | $171 | 58 |
| 1611 Wheatstone Dr | 0.54mi | 3/1.0 | 2,000 (+6%) | 10mo | $248,000 | $124 | 54 |
| 1749 Maplewood Dr | 0.21mi | 4/2.0 (+1) | 1,668 (-11%) | 20mo | $335,000 | $201 | 47 |
| 6017 Palomino Ct | 0.45mi | 4/2.5 (+1) | 2,098 (+12%) | 24mo | $360,000 | $172 | 31 |
| 5773 Bonnie Brae Cir | 0.68mi | 4/2.0 (+1) | 1,731 (-8%) | 22mo | $267,500 | $155 | 30 |
Match score weights: distance 35% · size 25% · config 20% · recency 20%. Top-matched comps best support the ARV.
Projected returns pro-forma
-3.0% appreciation · 3.0% rent growth · sell at horizon
- IRR
- -19.5%
- Equity multiple
- 0.32×
- Total profit
- $-57,152
- Equity at exit
- $44,716
- IRR
- -12.1%
- Equity multiple
- 0.28×
- Total profit
- $-60,306
- Equity at exit
- $25,930
Cash invested: $83,972 (down + closing). Projections, not guarantees.
Landlord ↔ Tenant lean methodology
- Overall (STATE)
- 15 Strongly Tenant-Friendly
- State New York
- 15 Strongly Tenant-Friendly · D+10
- County
- — inherits STATE
- City
- — inherits STATE
ZIP-level market 14425
- Home prices YoY
- -15.1%
- Active inventory
- 73
- Price-to-rent
- 9.2×
Monthly cashflow live
- Estimated rent
- $2,720 medium interval (Pro) →
- Mortgage (P&I)
- −$1,573
- Tax from tax record
- −$589 /mo · $7,062/yr
- Insurance
- −$125
- HOA
- −$0
- Vacancy / Maint / Mgmt
- −$571
- Net cashflow
- $-137
Break-even live
Sensitivity live
| Price | -10% $33 | -5% $-52 | +0% $-137 | +5% $-222 | +10% $-307 |
|---|---|---|---|---|---|
| Rent | -10% $-352 | -5% $-244 | +0% $-137 | +5% $-30 | +10% $78 |
| Rate | -1.0pp $14 | -0.5pp $-61 | base $-137 | +0.5pp $-215 | +1.0pp $-294 |
UW: 25.0% down · 7.5% · 30yr · 1.5% tax · 5.0% vac · 8.0% maint · 8.0% mgmt
Financing live
Cash to close
- Down payment
- $74,975
- Closing costs
- $8,997
- Reserves months
- —
- Total cash needed
- —
Loan-product check · same deal, 3 products live
Conventional
25% down · 7.5% · 30yr
- Down + closing
- —
- Monthly P&I
- —
- Monthly cashflow
- —
- DSCR
- —
- Eligible?
- —
Personal DTI + credit; lowest rate.
DSCR
20% down · 8.5% · 30yr
- Down + closing
- —
- Monthly P&I
- —
- Monthly cashflow
- —
- DSCR
- —
- Eligible?
- —
No personal income docs; deal must DSCR.
Hard money
10% down · 12.0% · 12mo
- Down + closing
- —
- Monthly P&I
- —
- Monthly cashflow
- —
- DSCR
- —
- Eligible?
- —
Short-term bridge; refi at stabilization.
Rent comps 3 comps
| Address | Beds | Baths | Sqft | Rent | $/sqft | DOM | Units | Dist |
|---|---|---|---|---|---|---|---|---|
| 1512 Redfern Dr Farmington, NY | 3.0 | 2.5 | 1688 | $2,800 | $1.66 | 4d | 1 | 1.06mi |
| 1515 Red Fern Dr Unit 1512 Farmington, NY | 3.0 | 2.5 | 1688 | $2,800 | $1.66 | 4d | 1 | 1.06mi |
| 1188 Barry Pl Farmington, NY | 1.0–3.0 | 1.0–2.5 | 1072 | $2,675 | $2.50 | 4d | 12 | 1.11mi |
Listing history 13 events
-
2026-06-22days on market $299,900 Active 17 DOM
-
2026-06-18days on market $299,900 Active 14 DOM
-
2026-06-17days on market $299,900 Active 13 DOM
-
2026-06-16days on market $299,900 Active 12 DOM
-
2026-06-15price $299,900 Active 11 DOM
-
2026-06-15days on market $315,000 Active 11 DOM
-
2026-06-13days on market $315,000 Active 9 DOM
-
2026-06-13days on market $315,000 Active 8 DOM
-
2026-06-10days on market $315,000 Active 6 DOM
-
2026-06-09days on market $315,000 Active 5 DOM
-
2026-06-09days on market $315,000 Active 4 DOM
-
2026-06-07remarks 695-char remark
-
2026-06-07$315,000 Active 3 DOM
ⓘ Source: listings_history table (triggers on properties + properties_extension) + one-shot
backfill from property_details.listing_events for pre-trigger history.
Tax reassessment forecast NY · Partial reset (capped growth)
- Current annual tax
- $7,062 · $589/mo
- Projected year-2 tax
- $7,062 · $589/mo
- Expected delta
- $0/yr ($0/mo · 0.0%)
ⓘ Screening estimate from a state-policy table — verify with the county assessor before closing.
Climate risk First Street
- Flood 1/10 Low FEMA zone X · 0% chance over 30 yrs
- Wildfire 2/10 Low
- Heat 2/10 Low 7 d/yr ≥95°F today · 16 d/yr by 30 yrs out
- Wind 1/10 Low
- Air quality 2/10 Low 0 unhealthy d/yr today · 1 by 30 yrs out
Nearby sold comps map
Loading sold comps map…
Walkable amenities ~0.75 mi
Loading nearby amenities…
Taxation est. · year 1
- Rental income
- $32,645
- − Mortgage interest
- −$16,799
- − Property taxes
- −$7,062
- − Insurance
- −$1,500
- − Repairs & maintenance
- −$2,612
- − Management
- −$2,612
- − Depreciation
- −$8,724
- Taxable loss
- −$6,663
- Est. tax savings @ 24.0%
- +$1,599
- After-tax cash flow
- $-45/yr
For passive investors: Depreciation is non-cash, so a rental often shows a tax loss while cash-flowing — sheltering income. Rental losses are passive: they offset passive income freely, and up to $25,000/yr can offset ordinary (W-2) income if you actively participate and your MAGI is under $100k (phasing out to $0 by $150k); unused losses carry forward. On sale, claimed depreciation is recaptured at up to 25%, and gains may owe capital-gains tax (a 1031 exchange can defer both). Figures are a year-1 estimate at your 24.0% rate — not tax advice; consult a CPA.
Schools (NCES district)
- District
- Canandaigua City School District
- NCES district ID
- 3606330
- Math proficiency
- 50% ▼ -10.00%
- Reading proficiency
- 59% ▲ 4.00%
- Median HH income
- $56,375
- Composite
- 47.09/100
- National rank
- #2335
- State rank
- #305 of 590 in NY
Livability — Canandaigua
- Score
- 75/100
- State rank
- #243
- US rank
- #3822
Category grades
Schools grade is shown separately in the Schools card above.
Census & demographics
- County
- Ontario County · 58,989 people
- City population
- 28,786
- Metro
- Rochester, NY
- Population (ZIP)
- 13,839
- Household income
- $94,609
- Rent vs Own
- Severe rent burden
- 257.0
Population outlook (Ontario County) Hauer SSP2
- Today (2025)
- 111,230 people
- By 2030
- 111,401 · +0.2%
- By 2040
- 109,535 · -1.5%
- By 2050
- 104,895 · -5.7%
- By 2075
- 92,999 · -16.4%
- By 2100
- 73,723 · -33.7%
Race, ethnicity, and origin ACS 2023
- Neighborhood character
- Predominantly White (86%)
- Race & ethnicity
- White 86% Two or more races 7% Hispanic / Latino 5% Black 2% Asian 2%
- Hispanic origin (detail)
- Puerto Rican 3% Dominican 1%
- Common ancestry
- Romanian 6% Lithuanian 5% Iranian 4%
- Foreign-born
- 3% · Canada, South Korea
- Languages at home
- 94% English-only · Spanish 3% Other Indo-European 1%
Political lean MEDSL · Ontario
- 2024 margin
- Toss-up / Even · D 49.4% · R 50.6%
- 2008→2024 swing
- -1.0pp toward R · 2008: -0.1pp · 2024: -1.2pp
- All cycles
- 2024: R+1.2 2020: R+0.0 2016: R+8.6 2012: R+1.6 2008: R+0.1
Not yet ingested
- Civics
- —
Market trends
- HPI YoY
- ▼ -47.59%
- Current HPI
- 267.0192
- Rent YoY
- —
- Metro
- Rochester, NY
- State GDP YoY
- ▲ 2.60%
- F500 in state
- 92
Industry mix (Fortune 500 HQ in NY)
| Industry | F500 HQs | Revenue |
|---|---|---|
| Financial Services | 10 | $950B |
|
||
| Consumer Goods | 9 | $162B |
|
||
| Insurance | 4 | $225B |
|
||
| Telecommunications | 2 | $144B |
|
||
| Pharmaceuticals | 2 | $112B |
|
||
| Media / Entertainment | 2 | $69B |
|
||
Price history
1 event — show timeline
- 2026-06-04 Listed $315,000 UNYREIS
Property tax history
+6.2%/yrLatest (2025): $7,062 · +32.1% YoY. Source: county tax records.
Cash-flow waterfall
monthlySold comps — $/sqft
last 12 mo · ≤1 miLoading sold comps…