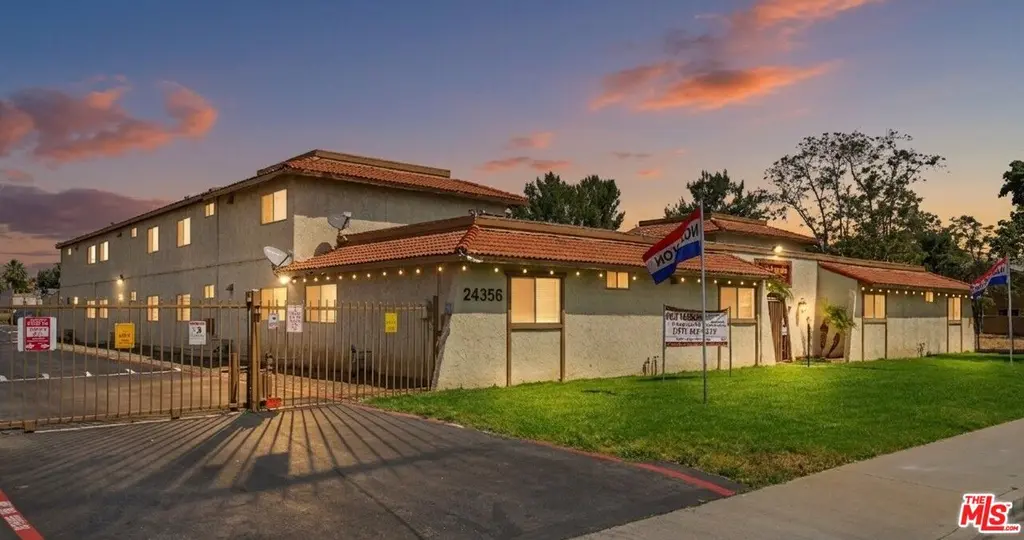
24356 Webster Ave
Moreno Valley, CA 92553
$3,295,000C-
42 bd · 28.0 ba ·
12,696 sqft ·
Built 1980
· MultiFamily
· Active
· 45 DOM
Cashflow @ list (25.0% down · 7.5%)
Estimated rent
$33,495/mo
Mortgage (P&I)
−$17,279
Tax + insurance
−$3,082
HOA
−$0
Vac / Maint / Mgmt
−$7,034
Net cashflow
$6,099/mo
Annual
$73,192/yr
Cap rate
8.51%
Cash-on-cash
7.93%
DSCR
1.35
1% rule
1.02%
Cash to close
$922,600
Investor read
- This is a 14 × 3-bed/2.0-bath units multifamily listed at $3.29M.
- At list price, monthly cash flow is $6k ($73k/yr) — positive. Per door: $436/mo.
- The deal already cash-flows at list — no discount required.
- Meets the 1% rule at list price ($33k rent vs $3.29M).
- It's been on market 45 days — a 3% lower offer ($3.20M) is reasonable based on typical stale-listing flexibility.
- Recommended offer: $3.20M (3.0% below list) — sets the bar for market timing.
- Local home prices are declining (-3.0%/yr); year-one equity from $23k of loan paydown is wiped out by about $99k of value loss. Plan a longer hold.
- Location reads 55/100 on livability (#838 in CA) — a working-class tenant base; expect higher turnover. Strengths: housing A+, employment B; Watch: schools D-, amenities F, commute F.
- Moreno Valley Unified (suburban): math 23% / reading 34% proficiency, ranked #1,050 of 1,400 in CA (top 75%) — low school quality limits family demand, transient renter base, plan for 1-2y turnover; 69% free/reduced lunch — lower-income household profile, screen leases tightly.
- Market conditions: Rents rising (+2.1%/yr); 81 active listings in the ZIP; solid renter incomes; 9,195 units permitted in Riverside County in 2024 (1,512 in 5+ unit buildings).
- Riverside County population projected at +22% by 2050 — long-run rental-demand tailwind backs the buy-and-hold thesis.
- 3 sale attempts since 21y ago with the ask held roughly flat each time — persistent listings suggest the price (not the market) is what's stuck; bring a comps-based counter.
- Current owner paid $2.75M; 20% above their basis — modest negotiation headroom, anchor on the comps not their cost.
- Climate carrying-cost: extreme-heat days projected 7→22/yr by 2055 (HVAC capex compounding) — expect insurance premiums to compound above CPI over the hold.
- Cap rate 8.5% vs local median 3.9% in Moreno Valley — top-decile yield for the area; either an underpriced asset or a hidden risk that comps aren't pricing in. Stress-test before assuming the spread holds.
- At $33,495/mo this rent would consume 514% of the median local household income ($78k/yr) (locally 3671% of renters already pay >50% of income on rent) — very limited rent-growth headroom before tenants either downsize or default.
Questions for listing agent
- It's been on market 45 days. Have you received any prior offers? Is the seller open to a 3% concession, seller financing, or rate buy-down credit?
- Can we see the unit-by-unit rent roll, current vacancy, and any below-market leases? What's the average tenancy length?
- What capital expenditures (roof, boiler, parking lot, exteriors) have been made in the last 5 years, and what's planned in the next 2?
- Is there a deadline driving the sale (1031 exchange, divorce, estate, relocation)? That informs how much negotiation room exists.
- Schools are D-rated, which usually means shorter tenancies and higher turnover. Who's the typical renter profile here, and what's been the actual vacancy rate?
- What's the average days-on-market for RENTAL listings here right now (not sales)? A rising rental-DOM trend means longer vacancies and softer asking-rent achievability than the comps imply.
- What's the recent tenant-quality profile in this submarket — average credit score on applications, eviction rate, late-payment / NSF rate, and stable-employment percentage? A property-management company in the area should have these aggregated.
- How much new apartment / multifamily construction is in the pipeline within 1–3 miles? Heavy new supply (>2% of stock underway) typically softens rents 12–24 months out; light construction supports rent growth.
CashFlowRE · CFR-1MB7ZA4FD9TF4C
· Data 2 days ago
cashflowre.app · 2026-05-29