 14-Plex
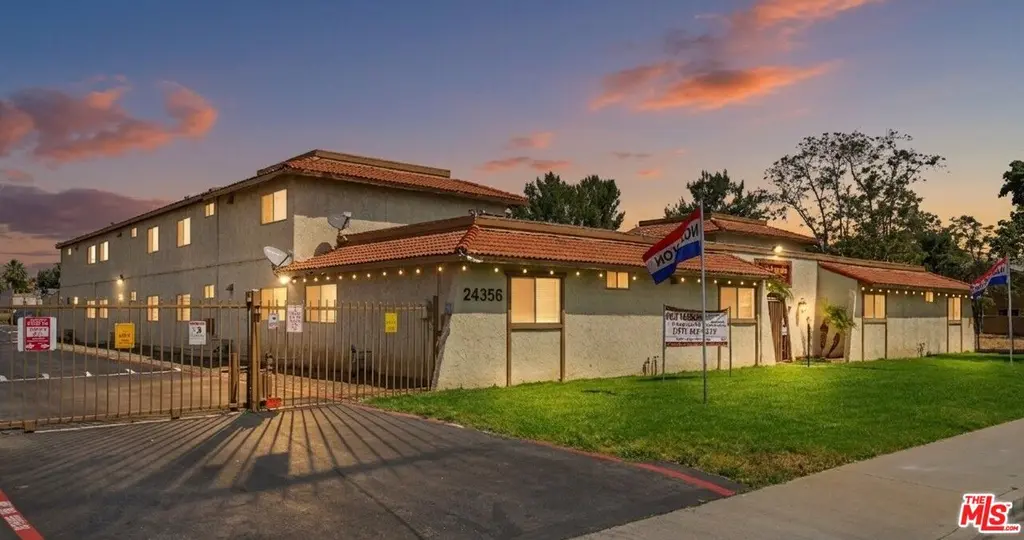
24356 Webster Ave · Moreno Valley, CA
Flood risk 1/10 · Minimal
- FEMA flood zone
- X (unshaded)
- Chance of flooding over 30 yrs
- 0.0%
- Est. flood insurance / yr
- $507 – $1,088
Fire risk 3/10 · Minor
- Est. fire insurance / yr
- $659 – $1,223
Heat risk 7/10 · Major
- Hot days now (above 100°F)
- 7 days/yr
- Hot days in 30 yrs
- 22 days/yr
Wind risk 1/10 · Minimal
- Chance of severe wind over 30 yrs
- —
Air-quality risk 9/10 · Severe
- Unhealthy air days now
- 21 days/yr
- Unhealthy air days in 30 yrs
- 25 days/yr
Risk factors via First Street. Map © Google.
Why this score? — see what drove the C- grade
The composite is a weighted blend of 9 inputs, each scored 0–100. Each bar is that input's sub-score; the figure is the points it added to the 100-point composite (weight × sub-score).
- Cash flow +23.4/30.0
- DSCR +7.5/10.0
- ARV discount +5.5/15.0
- 1% rule +5.2/10.0
- Rent growth +3.0/5.0
- Schools +2.8/10.0
- Livability +2.8/5.0
- Condition / age +2.5/5.0
- Appreciation +0.0/10.0
$3,295,000
🖨 Deal sheet 📄 Offer letter ✓ Due diligence
Multi-family units
County records classify this as Multi-Family (5+ Unit). Listing-text estimate: 14 units. confirmed
5+ unit building — per-unit beds/baths from public records are typically unavailable; the breakdown below (if shown) is an estimate from the listing text.
Listing remarks MLS
We are pleased to present Casa Lynnda, a 14 unit multifamily investment opportunity located at 24356 Webster Avenue in the Sunnymead neighborhood of Moreno Valley. The property is ideally situated just south of Sunnymead Boulevard with convenient access to the 60 Freeway via the Heacock Street exit, offering a balance of a quiet residential setting and close proximity to major retail, employment centers, and transportation corridors. Constructed in 1980, Casa Lynnda is a gated, courtyard style apartment community positioned on an expansive approximately 39,640 square foot lot. The property is zoned R2 and features a well designed layout that includes 24 on site parking spaces and a central courtyard that enhances the overall tenant experience. The unit mix consists of ten two bedroom one bathroom units and four one bedroom one bathroom units, providing functional floor plans that appeal to a wide range of renters. The property offers desirable amenities including secured entry, a well maintained courtyard environment, on site laundry, and ample parking, all located on a low traffic street. Residents benefit from close proximity to Moreno Valley Mall, nearby schools, parks, and the region's major employment hubs within the Inland Empire. Casa Lynnda is being offered at a 6% cap rate and a 10.98 gross income multiplier, presenting investors with stable in place income and the opportunity to further enhance returns through continued operational efficiencies and strategic unit upgrades. Moreno Valley continues to experience steady growth supported by its relative affordability, strong freeway connectivity, and access to major logistics and employment centers throughout the Inland Empire. With rental rates remaining accessible relative to local incomes, the market continues to demonstrate consistent tenant demand and long term investment fundamentals.
Key facts
- On site laundry
- Ample parking
- Low traffic street
Tags
Neighborhood map
What this means for you Summary
Snapshot
- This is a 14 × 3-bed/2.0-bath units multifamily listed at $3.29M.
Deal economics
- At list price, monthly cash flow is $6k ($73k/yr) — positive. Per door: $436/mo.
- The deal already cash-flows at list — no discount required.
- Meets the 1% rule at list price ($33k rent vs $3.29M).
- Recommended offer: $3.20M (3.0% below list) — sets the bar for market timing.
- Cap rate 8.5% vs local median 3.9% in Moreno Valley — top-decile yield for the area; either an underpriced asset or a hidden risk that comps aren't pricing in. Stress-test before assuming the spread holds.
Location & tenants
- Location reads 55/100 on livability (#838 in CA) — a working-class tenant base; expect higher turnover. Strengths: housing A+, employment B; Watch: schools D-, amenities F, commute F.
- Moreno Valley Unified (suburban): math 23% / reading 34% proficiency, ranked #1,050 of 1,400 in CA (top 75%) — low school quality limits family demand, transient renter base, plan for 1-2y turnover; 69% free/reduced lunch — lower-income household profile, screen leases tightly.
- Market conditions: Rents rising (+2.1%/yr); 81 active listings in the ZIP; solid renter incomes; 9,195 units permitted in Riverside County in 2024 (1,512 in 5+ unit buildings).
- At $33,495/mo this rent would consume 514% of the median local household income ($78k/yr) (locally 3671% of renters already pay >50% of income on rent) — very limited rent-growth headroom before tenants either downsize or default.
Forward outlook
- Local home prices are declining (-3.0%/yr); year-one equity from $23k of loan paydown is wiped out by about $99k of value loss. Plan a longer hold.
- Riverside County population projected at +22% by 2050 — long-run rental-demand tailwind backs the buy-and-hold thesis.
Negotiation context
- It's been on market 45 days — a 3% lower offer ($3.20M) is reasonable based on typical stale-listing flexibility.
- 3 sale attempts since 21y ago with the ask held roughly flat each time — persistent listings suggest the price (not the market) is what's stuck; bring a comps-based counter.
- Current owner paid $2.75M; 20% above their basis — modest negotiation headroom, anchor on the comps not their cost.
Risks & watch-outs
- Climate carrying-cost: extreme-heat days projected 7→22/yr by 2055 (HVAC capex compounding) — expect insurance premiums to compound above CPI over the hold.
Questions for the listing agent
- It's been on market 45 days. Have you received any prior offers? Is the seller open to a 3% concession, seller financing, or rate buy-down credit?
- Can we see the unit-by-unit rent roll, current vacancy, and any below-market leases? What's the average tenancy length?
- What capital expenditures (roof, boiler, parking lot, exteriors) have been made in the last 5 years, and what's planned in the next 2?
- Is there a deadline driving the sale (1031 exchange, divorce, estate, relocation)? That informs how much negotiation room exists.
- Schools are D-rated, which usually means shorter tenancies and higher turnover. Who's the typical renter profile here, and what's been the actual vacancy rate?
- What's the average days-on-market for RENTAL listings here right now (not sales)? A rising rental-DOM trend means longer vacancies and softer asking-rent achievability than the comps imply.
- What's the recent tenant-quality profile in this submarket — average credit score on applications, eviction rate, late-payment / NSF rate, and stable-employment percentage? A property-management company in the area should have these aggregated.
- How much new apartment / multifamily construction is in the pipeline within 1–3 miles? Heavy new supply (>2% of stock underway) typically softens rents 12–24 months out; light construction supports rent growth.
Investment metrics
- 1% rule
- 1.02% ✓
- Cap rate
- 8.51%
- Cash-on-cash
- 7.93%
- DSCR
- 1.35
- GRM
- 8.2
CMA / ARV
- ARV (median comp)
- $3,158,067
- List price
- $3,295,000
- Delta
- 4.34%
- Verdict
- FAIR
- Comps
- 2 within 1.0 mi
Projected returns pro-forma
-3.0% appreciation · 2.08% rent growth · sell at horizon
- IRR
- -5.2%
- Equity multiple
- 0.81×
- Total profit
- $-177,162
- Equity at exit
- $491,295
- IRR
- 3.4%
- Equity multiple
- 1.24×
- Total profit
- $218,224
- Equity at exit
- $284,891
Cash invested: $922,600 (down + closing). Projections, not guarantees.
Landlord ↔ Tenant lean methodology
- Overall (STATE)
- 18 Strongly Tenant-Friendly
- State California
- 18 Strongly Tenant-Friendly · D+13
- County
- — inherits STATE
- City
- — inherits STATE
ZIP-level market 92553
- Home prices YoY
- -11.8%
- Rents YoY
- 2.1%
- Active inventory
- 81
- Price-to-rent
- 114.8×
Monthly cashflow live
- Estimated rent
- $33,495 high interval (Pro) →
- Mortgage (P&I)
- −$17,279
- Tax from tax record
- −$1,709 /mo · $20,513/yr
- Insurance
- −$1,373
- HOA
- −$0
- Vacancy / Maint / Mgmt
- −$7,034
- Net cashflow
- $6,099
Break-even live
14-unit breakdown (identical units grouped — click to expand)
| Units | Beds | Baths | Est. rent |
|---|---|---|---|
| 14× units | 3 | 2 | $33,488 |
| #1 | 3 | 2 | $2,392 |
| #2 | 3 | 2 | $2,392 |
| #3 | 3 | 2 | $2,392 |
| #4 | 3 | 2 | $2,392 |
| #5 | 3 | 2 | $2,392 |
| #6 | 3 | 2 | $2,392 |
| #7 | 3 | 2 | $2,392 |
| #8 | 3 | 2 | $2,392 |
| #9 | 3 | 2 | $2,392 |
| #10 | 3 | 2 | $2,392 |
| #11 | 3 | 2 | $2,392 |
| #12 | 3 | 2 | $2,392 |
| #13 | 3 | 2 | $2,392 |
| #14 | 3 | 2 | $2,392 |
| Total (14 units) | $33,495 | ||
UW: 25.0% down · 7.5% · 30yr · 1.5% tax · 5.0% vac · 8.0% maint · 8.0% mgmt
Financing live
Cash to close
- Down payment
- $823,750
- Closing costs
- $98,850
- Reserves months
- —
- Total cash needed
- —
Loan-product check · same deal, 3 products live
Conventional
25% down · 7.5% · 30yr
- Down + closing
- —
- Monthly P&I
- —
- Monthly cashflow
- —
- DSCR
- —
- Eligible?
- —
Personal DTI + credit; lowest rate.
DSCR
20% down · 8.5% · 30yr
- Down + closing
- —
- Monthly P&I
- —
- Monthly cashflow
- —
- DSCR
- —
- Eligible?
- —
No personal income docs; deal must DSCR.
Hard money
10% down · 12.0% · 12mo
- Down + closing
- —
- Monthly P&I
- —
- Monthly cashflow
- —
- DSCR
- —
- Eligible?
- —
Short-term bridge; refi at stabilization.
Listing history 23 events
-
2026-06-18days on market $3,295,000 Active 45 DOM
-
2026-06-17days on market $3,295,000 Active 44 DOM
-
2026-06-16days on market $3,295,000 Active 43 DOM
-
2026-06-15days on market $3,295,000 Active 42 DOM
-
2026-06-13days on market $3,295,000 Active 40 DOM
-
2026-06-13days on market $3,295,000 Active 39 DOM
-
2026-06-09days on market $3,295,000 Active 36 DOM
-
2026-06-08days on market $3,295,000 Active 35 DOM
-
2026-06-07days on market $3,295,000 Active 34 DOM
-
2026-06-04days on market $3,295,000 Active 31 DOM
-
2026-06-03days on market $3,295,000 Active 30 DOM
-
2026-06-02days on market $3,295,000 Active 29 DOM
-
2026-06-01days on market $3,295,000 Active 28 DOM
-
2026-05-31days on market $3,295,000 Active 27 DOM
-
2026-05-04$3,295,000 Active 1878-char remark
Show marketing remark (1878 chars)
We are pleased to present Casa Lynnda, a 14 unit multifamily investment opportunity located at 24356 Webster Avenue in the Sunnymead neighborhood of Moreno Valley. The property is ideally situated just south of Sunnymead Boulevard with convenient access to the 60 Freeway via the Heacock Street exit, offering a balance of a quiet residential setting and close proximity to major retail, employment centers, and transportation corridors. Constructed in 1980, Casa Lynnda is a gated, courtyard style apartment community positioned on an expansive approximately 39,640 square foot lot. The property is zoned R2 and features a well designed layout that includes 24 on site parking spaces and a central courtyard that enhances the overall tenant experience. The unit mix consists of ten two bedroom one bathroom units and four one bedroom one bathroom units, providing functional floor plans that appeal to a wide range of renters. The property offers desirable amenities including secured entry, a well maintained courtyard environment, on site laundry, and ample parking, all located on a low traffic street. Residents benefit from close proximity to Moreno Valley Mall, nearby schools, parks, and the region's major employment hubs within the Inland Empire. Casa Lynnda is being offered at a 6% cap rate and a 10.98 gross income multiplier, presenting investors with stable in place income and the opportunity to further enhance returns through continued operational efficiencies and strategic unit upgrades. Moreno Valley continues to experience steady growth supported by its relative affordability, strong freeway connectivity, and access to major logistics and employment centers throughout the Inland Empire. With rental rates remaining accessible relative to local incomes, the market continues to demonstrate consistent tenant demand and long term investment fundamentals.
-
2025-04-29Active
-
2016-10-12soldstatus $2,750,000
-
2006-07-01historical
-
2005-07-04$1,500,000
-
2003-10-28soldstatus $1,624,000
-
2003-06-27soldstatus $1,350,000
-
1997-02-28soldstatus $300,000
-
1989-09-29soldstatus $707,000
ⓘ Source: listings_history table (triggers on properties + properties_extension) + one-shot
backfill from property_details.listing_events for pre-trigger history.
Tax reassessment forecast CA · Resets to sale price
- Current annual tax
- $20,513 · $1,709/mo
- Projected year-2 tax
- $25,042 · $2,087/mo
- Expected delta
- +$4,529/yr (+$377/mo · 22.1%)
ⓘ Screening estimate from a state-policy table — verify with the county assessor before closing.
Climate risk First Street
- Flood 1/10 Low FEMA zone X (unshaded) · 0% chance over 30 yrs
- Wildfire 3/10 Moderate
- Heat 7/10 Severe 7 d/yr ≥100°F today · 22 d/yr by 30 yrs out
- Wind 1/10 Low
- Air quality 9/10 Extreme 21 unhealthy d/yr today · 25 by 30 yrs out
Nearby sold comps map
Loading sold comps map…
Walkable amenities ~0.75 mi
Loading nearby amenities…
Taxation est. · year 1
- Rental income
- $401,940
- − Mortgage interest
- −$184,571
- − Property taxes
- −$20,513
- − Insurance
- −$16,475
- − Repairs & maintenance
- −$32,155
- − Management
- −$32,155
- − Depreciation
- −$95,855
- Taxable income
- $20,215
- Est. tax owed @ 24.0%
- −$4,852
- After-tax cash flow
- $68,340/yr
For passive investors: Depreciation is non-cash, so a rental often shows a tax loss while cash-flowing — sheltering income. Rental losses are passive: they offset passive income freely, and up to $25,000/yr can offset ordinary (W-2) income if you actively participate and your MAGI is under $100k (phasing out to $0 by $150k); unused losses carry forward. On sale, claimed depreciation is recaptured at up to 25%, and gains may owe capital-gains tax (a 1031 exchange can defer both). Figures are a year-1 estimate at your 24.0% rate — not tax advice; consult a CPA.
Schools (NCES district)
- District
- Moreno Valley Unified
- NCES district ID
- 0625800
- Math proficiency
- 23% ▲ 1.00%
- Reading proficiency
- 34% ▲ 3.00%
- Median HH income
- $55,495
- Composite
- 28.36/100
- National rank
- #12131
- State rank
- #1050 of 1400 in CA
Livability — Moreno Valley
- Score
- 55/100
- State rank
- #838
- US rank
- #23203
Category grades
Schools grade is shown separately in the Schools card above.
Census & demographics
- Census place
- Moreno Valley, CA
- County
- Riverside County · 2,287,001 people
- City population
- 212,104
- Metro
- Riverside-San Bernardino-Ontario, CA
- Population (ZIP)
- 74,640
- Household income
- $78,246
- Rent vs Own
- Severe rent burden
- 3671.0
Population outlook (Riverside County) Hauer SSP2
- Today (2025)
- 2,664,475 people
- By 2030
- 2,802,692 · +5.2%
- By 2040
- 3,050,904 · +14.5%
- By 2050
- 3,256,783 · +22.2%
- By 2075
- 3,655,058 · +37.2%
- By 2100
- 3,766,594 · +41.4%
Race, ethnicity, and origin ACS 2023
- Neighborhood character
- Predominantly Hispanic (67%)
- Race & ethnicity
- Hispanic / Latino 67% Black 15% Two or more races 13% White 10% Asian 5% Native American 1%
- Hispanic origin (detail)
- Mexican 58%
- Foreign-born
- 28% · Canada, Vietnam, China
- Languages at home
- 44% English-only · Spanish 51% Tagalog/Filipino 2% Other Indo-European 1%
Political lean MEDSL · Riverside
- 2024 margin
- Toss-up / Even · D 48.0% · R 49.3% · Other 2.6%
- 2008→2024 swing
- -3.6pp toward R · 2008: 2.3pp · 2024: -1.3pp
- All cycles
- 2024: R+1.3 2020: D+8.0 2016: D+4.3 2012: R+0.4 2008: D+2.3
Not yet ingested
- Civics
- —
Market trends
- HPI YoY
- ▼ -65.16%
- Current HPI
- 486.4402
- Rent YoY
- ▲ 2.08%
- Metro
- Riverside-San Bernardino-Ontario, CA
- State GDP YoY
- ▲ 3.21%
- F500 in state
- 116
Industry mix (Fortune 500 HQ in CA)
| Industry | F500 HQs | Revenue |
|---|---|---|
| Technology | 27 | $1,492B |
|
||
| Financial Services | 3 | $174B |
|
||
| Retail | 3 | $44B |
|
||
| Insurance | 3 | $26B |
|
||
| Media / Entertainment | 2 | $115B |
|
||
| Pharmaceuticals / Biotech | 2 | $62B |
|
||
Price history
+366.1% since first listed9 events — show timeline
- 2026-05-04 Listed $3,295,000 TheMLS
- 2025-04-29 Listed — TheMLS
- 2016-10-12 Sold (Public Records) $2,750,000 Public Records
- 2006-07-01 Listing Removed — CRMLS
- 2005-07-04 Listed $1,500,000 CRMLS
- 2003-10-28 Sold (Public Records) $1,624,000 Public Records
- 2003-06-27 Sold (Public Records) $1,350,000 Public Records
- 1997-02-28 Sold (Public Records) $300,000 Public Records
- 1989-09-29 Sold (Public Records) $707,000 Public Records
Property tax history
+1.8%/yrLatest (2025): $20,513 · +3.1% YoY. Source: county tax records.
Cash-flow waterfall
monthlySold comps — $/sqft
last 12 mo · ≤1 miLoading sold comps…