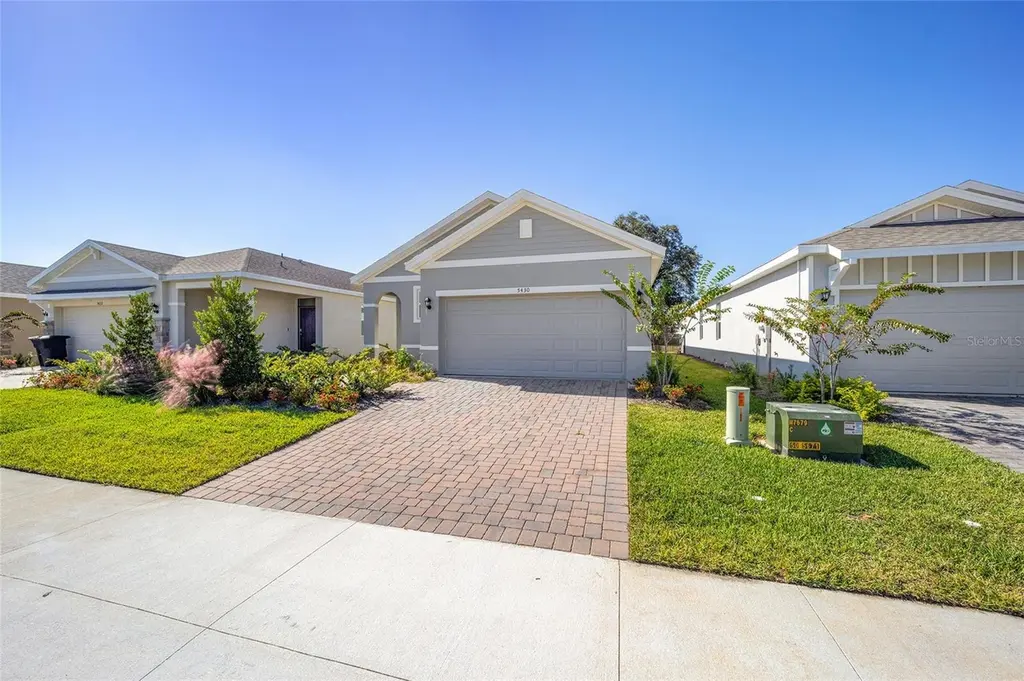
5430 NW 46th Lane Rd
Ocala, FL 34482
$289,500D-
3 bd · 2.0 ba ·
1,505 sqft ·
Built 2023
· SingleFamily
· Active
· 58 DOM
Cashflow @ list (25.0% down · 7.5%)
Estimated rent
$2,620/mo
Mortgage (P&I)
−$1,518
Tax + insurance
−$518
HOA
−$498
Vac / Maint / Mgmt
−$550
Net cashflow
$-465/mo
Annual
$-5,575/yr
Cap rate
4.37%
Cash-on-cash
-6.88%
DSCR
0.69
1% rule
0.90%
Cash to close
$81,060
Investor read
- This is a 3-bed/2.0-bath single-family listed at $290k. Condition is rated good.
- At list price, monthly cash flow is $-465 ($-6k/yr) — negative.
- To cash-flow at today's rent, offer at most $207k (28.3% below list).
- To meet the 1% rule (rent ≥ 1% of price), the offer needs to be $262k (9.5% below list).
- It's been on market 58 days — a 3% lower offer ($281k) is reasonable based on typical stale-listing flexibility.
- Recommended offer: $207k (28.3% below list) — sets the bar for cash-flow.
- Local home prices are declining (-3.0%/yr); year-one equity from $2k of loan paydown is wiped out by about $9k of value loss. Plan a longer hold.
- Location reads 69/100 on livability (#476 in FL) — a middle-class / working-renter tenant base. Strengths: cost of living A+, housing A+, health & safety A+; Watch: crime F, amenities F, commute F.
- Marion (rural): math 42% / reading 43% proficiency, ranked #61 of 73 in FL (top 84%) — families likely to look elsewhere, expect single-tenant / working-renter base with shorter leases; 61% free/reduced lunch — lower-income household profile, screen leases tightly.
- Market conditions: Rents rising fast (+11.1%/yr); 663 active listings in the ZIP; 36 comparable units currently listed for rent nearby; rentals at typical pace (median 22d on market — plan ~3-4 weeks tenant-placement turnaround); 7,071 units permitted in Marion County in 2024 (534 in 5+ unit buildings).
- Marion County population projected at +13% by 2050 — modest demand growth; plan on rents tracking national, not racing it.
- 10 sale attempts since 4y ago with the ask held roughly flat each time — persistent listings suggest the price (not the market) is what's stuck; bring a comps-based counter.
- Climate carrying-cost: severe wind risk, 99% chance of damaging wind over 30y; moderate wildfire risk; extreme-heat days projected 7→23/yr by 2055 (HVAC capex compounding) — expect insurance premiums to compound above CPI over the hold.
- At $2,620/mo this rent would consume 48% of the median local household income ($66k/yr) (locally 282% of renters already pay >50% of income on rent) — very limited rent-growth headroom before tenants either downsize or default.
Questions for listing agent
- What do current leases actually rent for vs. the listed asking? Can we see a recent rent roll and the last 12 months of T-12 income?
- It's been on market 58 days. Have you received any prior offers? Is the seller open to a 28% concession, seller financing, or rate buy-down credit?
- What does the HOA fee cover, when was the last increase, and are there any pending special assessments or reserve-fund shortfalls?
- Is there a deadline driving the sale (1031 exchange, divorce, estate, relocation)? That informs how much negotiation room exists.
- Crime grade is F in this area — have there been break-ins, vandalism, or insurance claims at this property in the last 3 years? What carrier currently insures it and at what premium?
- The area grade is low — what's the realistic commute time and amenity access for the typical tenant pool here? Any planned neighborhood developments (good or bad) we should know about?
- What's the average days-on-market for RENTAL listings here right now (not sales)? A rising rental-DOM trend means longer vacancies and softer asking-rent achievability than the comps imply.
- What's the recent tenant-quality profile in this submarket — average credit score on applications, eviction rate, late-payment / NSF rate, and stable-employment percentage? A property-management company in the area should have these aggregated.
CashFlowRE · CFR-1MM1KW02ZR5KMZ
· Data 2 days ago
cashflowre.app · 2026-05-29