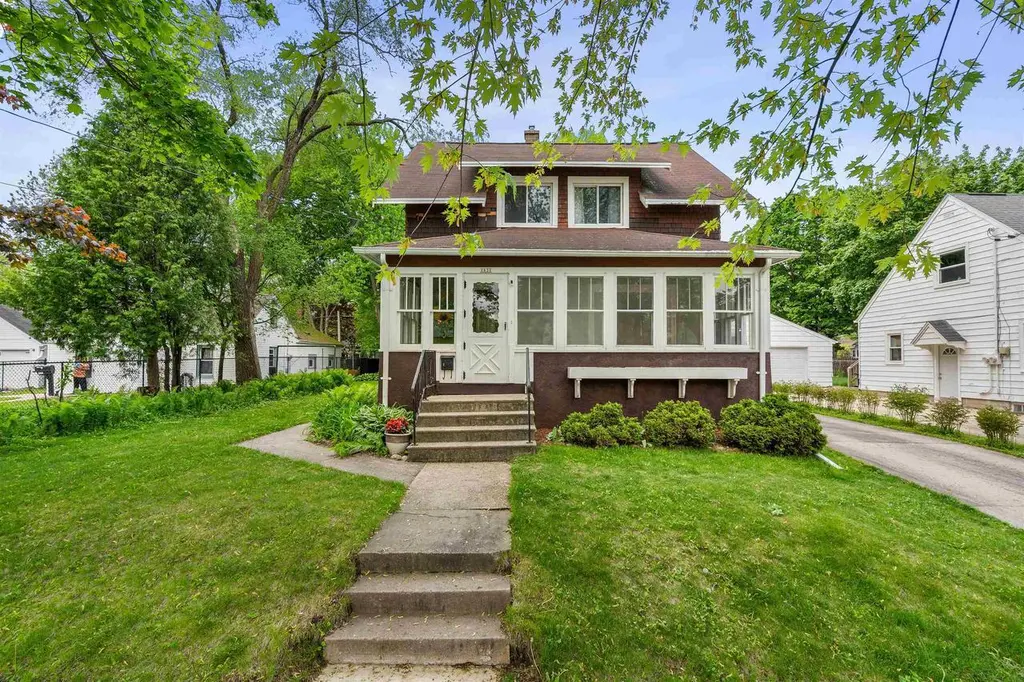
1631 N Alvin St
Appleton, WI 54911
$239,900D
3 bd · 1.0 ba ·
1,344 sqft ·
Built 1912
· SingleFamily
· Active
· 28 DOM
Cashflow @ list (25.0% down · 7.5%)
Estimated rent
$2,060/mo
Mortgage (P&I)
−$1,258
Tax + insurance
−$309
HOA
−$0
Vac / Maint / Mgmt
−$433
Net cashflow
$60/mo
Annual
$719/yr
Cap rate
6.59%
Cash-on-cash
1.07%
DSCR
1.05
1% rule
0.86%
Cash to close
$67,172
Investor read
- This is a 3-bed/1.0-bath single-family listed at $240k.
- At list price, monthly cash flow is $60 ($719/yr) — positive.
- The deal already cash-flows at list — no discount required.
- To meet the 1% rule (rent ≥ 1% of price), the offer needs to be $206k (14.1% below list).
- It's been on market 28 days — a 2% lower offer ($236k) is reasonable based on typical stale-listing flexibility.
- Recommended offer: $206k (14.1% below list) — sets the bar for 1% rule.
- Local home prices are declining (-3.0%/yr); year-one equity from $2k of loan paydown is wiped out by about $7k of value loss. Plan a longer hold.
- Location reads 82/100 on livability (#44 in WI, #1,073 nationally) — a professional / high-income tenant draw. Strengths: commute A+, cost of living A+, housing A+; Watch: amenities C-.
- Appleton Area School District (urban): math 33% / reading 36% proficiency, ranked #224 of 342 in WI (top 66%) — families likely to look elsewhere, expect single-tenant / working-renter base with shorter leases.
- Watch-outs: built in 1912 — expect roof / HVAC / electrical / plumbing capex.
- Market conditions: Rents flat; 32 active listings in the ZIP; 23 comparable units currently listed for rent nearby; rentals at typical pace (median 21d on market — plan ~3-4 weeks tenant-placement turnaround); 460 units permitted in Outagamie County in 2024 (30 in 5+ unit buildings).
- Outagamie County population projected at +8% by 2050 — modest demand growth; plan on rents tracking national, not racing it.
- Current owner paid $97k; list at $240k implies a 148% gain — meaningful room to come down on a strong offer.
- Cap rate 6.6% vs local median 3.8% in Appleton — top-decile yield for the area; either an underpriced asset or a hidden risk that comps aren't pricing in. Stress-test before assuming the spread holds.
- This rent runs 37% of the median local income ($67k/yr) — at the standard rent-burdened threshold; future hikes will face affordability resistance.
Questions for listing agent
- Built in 1912 — when were the roof, HVAC, electrical panel, plumbing, and water heater last replaced?
- Is there a deadline driving the sale (1031 exchange, divorce, estate, relocation)? That informs how much negotiation room exists.
- The area grade is low — what's the realistic commute time and amenity access for the typical tenant pool here? Any planned neighborhood developments (good or bad) we should know about?
- What's the average days-on-market for RENTAL listings here right now (not sales)? A rising rental-DOM trend means longer vacancies and softer asking-rent achievability than the comps imply.
- What's the recent tenant-quality profile in this submarket — average credit score on applications, eviction rate, late-payment / NSF rate, and stable-employment percentage? A property-management company in the area should have these aggregated.
- How much new for-sale + rental construction is in the pipeline within 1–3 miles? Heavy new supply typically softens prices + rents 12–24 months out; constrained supply supports both.
CashFlowRE · CFR-1MRS4DDP48B0FH
· Data 1 day ago
cashflowre.app · 2026-05-29