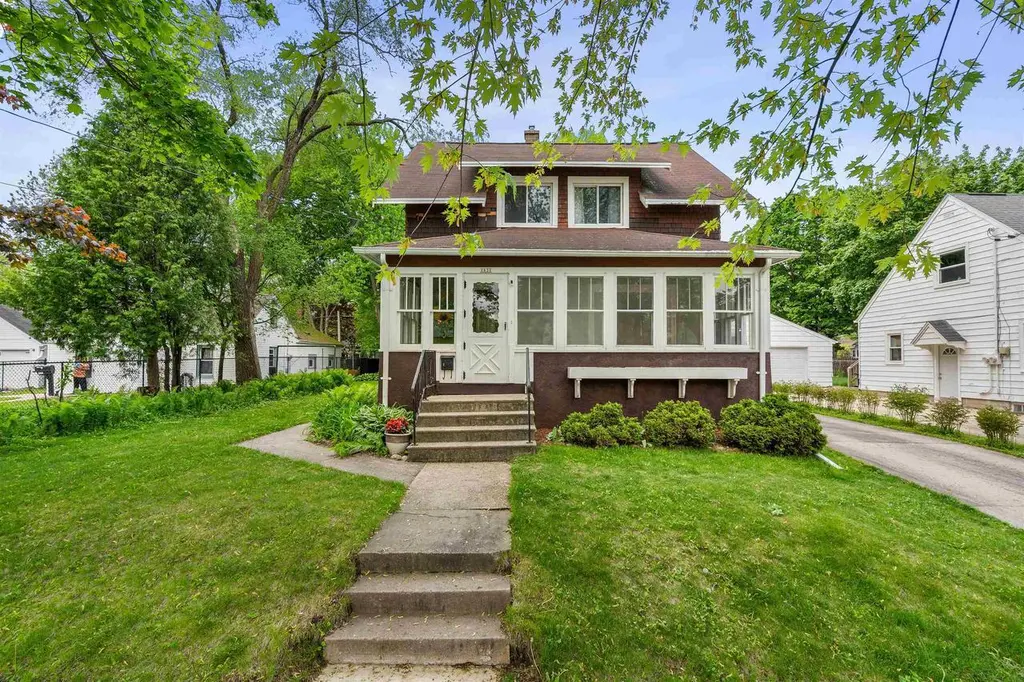
1631 N Alvin St · Appleton, WI
Flood risk 1/10 · Minimal
- FEMA flood zone
- X (unshaded)
- Chance of flooding over 30 yrs
- 0.0%
- Est. flood insurance / yr
- $473 – $860
Fire risk 1/10 · Minimal
- Est. fire insurance / yr
- $636 – $1,182
Heat risk 2/10 · Minimal
- Hot days now (above 97°F)
- 7 days/yr
- Hot days in 30 yrs
- 12 days/yr
Wind risk 2/10 · Minimal
- Chance of severe wind over 30 yrs
- —
Air-quality risk 3/10 · Minor
- Unhealthy air days now
- 2 days/yr
- Unhealthy air days in 30 yrs
- 3 days/yr
Risk factors via First Street. Map © Google.
Why this score? — see what drove the D grade
The composite is a weighted blend of 9 inputs, each scored 0–100. Each bar is that input's sub-score; the figure is the points it added to the 100-point composite (weight × sub-score).
- Cash flow +14.7/30.0
- ARV discount +8.1/15.0
- DSCR +4.5/10.0
- Livability +4.1/5.0
- 1% rule +3.6/10.0
- Schools +3.0/10.0
- Rent growth +2.7/5.0
- Condition / age +2.5/5.0
- Appreciation +0.0/10.0
$239,900
🖨 Deal sheet 📄 Offer letter ✓ Due diligence
Listing remarks
Lovely two-story home features original woodwork and hardwood flooring. Exterior features include a covered front porch and a detached garage. The property is situated on a large, deep lot with many mature trees, providing a private outdoor space. This residence offers traditional architectural character alongside a functional layout and yard space. This one will not last long, so schedule your private showing today.
Key facts
- Covered front porch
- Large deep lot
- Functional layout
Tags
Property features AI
Finance
- Other: Some window treatments and bedroom armoires/closets included; Dishwasher is excluded
Exterior
- Parking: Detached 2-car garage; Total of 2 garage parking spaces
- Utilities: Municipal water; Municipal sewer; Natural gas; Electric service (standard)
- Home design: Single-family, 2-story home; Construction completed; Lot is under 1/2 acre (approx. 0.21 acre); Residential zoning
- Construction: Cedar siding; Block foundation
- Exterior features: Cedar exterior; Sidewalks
Interior
- Kitchen: Microwave; Range/oven; Refrigerator; Formal dining room adjacent to the kitchen
- Bedrooms: Primary bedroom (upper level) — approximately 10 x 9; Bedroom 2 (upper level) — approximately 13 x 12; Bedroom 3 (upper level) — approximately 11 x 9; Bedroom 4 (upper level) — approximately 11 x 11
- Flooring: Wood floors
- Bathrooms: At least one tub; One full bathroom
- Heating & cooling: Natural gas heat; Central air conditioning
- Interior features: Cable/satellite available; High-speed internet available; Wood floors; Full basement with block foundation
- Laundry & utility: Washer and dryer included
Neighborhood map
What this means for you Summary
Snapshot
- This is a 3-bed/1.0-bath single-family listed at $240k.
Deal economics
- At list price, monthly cash flow is $60 ($719/yr) — positive.
- The deal already cash-flows at list — no discount required.
- To meet the 1% rule (rent ≥ 1% of price), the offer needs to be $206k (14.1% below list).
- Recommended offer: $206k (14.1% below list) — sets the bar for 1% rule.
- Cap rate 6.6% vs local median 3.8% in Appleton — top-decile yield for the area; either an underpriced asset or a hidden risk that comps aren't pricing in. Stress-test before assuming the spread holds.
Location & tenants
- Location reads 82/100 on livability (#44 in WI, #1,073 nationally) — a professional / high-income tenant draw. Strengths: commute A+, cost of living A+, housing A+; Watch: amenities C-.
- Appleton Area School District (urban): math 33% / reading 36% proficiency, ranked #224 of 342 in WI (top 66%) — families likely to look elsewhere, expect single-tenant / working-renter base with shorter leases.
- Market conditions: Rents flat; 32 active listings in the ZIP; 23 comparable units currently listed for rent nearby; rentals at typical pace (median 21d on market — plan ~3-4 weeks tenant-placement turnaround); 460 units permitted in Outagamie County in 2024 (30 in 5+ unit buildings).
- This rent runs 37% of the median local income ($67k/yr) — at the standard rent-burdened threshold; future hikes will face affordability resistance.
Forward outlook
- Local home prices are declining (-3.0%/yr); year-one equity from $2k of loan paydown is wiped out by about $7k of value loss. Plan a longer hold.
- Outagamie County population projected at +8% by 2050 — modest demand growth; plan on rents tracking national, not racing it.
Negotiation context
- It's been on market 28 days — a 2% lower offer ($236k) is reasonable based on typical stale-listing flexibility.
- Current owner paid $97k; list at $240k implies a 148% gain — meaningful room to come down on a strong offer.
Risks & watch-outs
- Watch-outs: built in 1912 — expect roof / HVAC / electrical / plumbing capex.
Questions for the listing agent
- Built in 1912 — when were the roof, HVAC, electrical panel, plumbing, and water heater last replaced?
- Is there a deadline driving the sale (1031 exchange, divorce, estate, relocation)? That informs how much negotiation room exists.
- The area grade is low — what's the realistic commute time and amenity access for the typical tenant pool here? Any planned neighborhood developments (good or bad) we should know about?
- What's the average days-on-market for RENTAL listings here right now (not sales)? A rising rental-DOM trend means longer vacancies and softer asking-rent achievability than the comps imply.
- What's the recent tenant-quality profile in this submarket — average credit score on applications, eviction rate, late-payment / NSF rate, and stable-employment percentage? A property-management company in the area should have these aggregated.
- How much new for-sale + rental construction is in the pipeline within 1–3 miles? Heavy new supply typically softens prices + rents 12–24 months out; constrained supply supports both.
Investment metrics
- 1% rule
- 0.86% ✗
- Cap rate
- 6.59%
- Cash-on-cash
- 1.07%
- DSCR
- 1.05
- GRM
- 9.7
CMA / ARV
- ARV (on-the-fly)
- $243,264
- Comps found
- 12
Show comp detail 12 sales within ~0.75 mi
| Address | Dist | Beds/Ba | Sqft | Sold | Price | $/sf | Match |
|---|---|---|---|---|---|---|---|
| 1904 N Alvin St | 0.19mi | 3/2.0 | 1,344 (0%) | 1mo | $281,000 | $209 | 86 |
| 1525 N Clark St | 0.19mi | 2/1.5 (-1) | 1,314 (-2%) | 2mo | $246,000 | $187 | 79 |
| 2108 N Richmond St | 0.35mi | 3/2.0 | 1,368 (+2%) | 3mo | $247,000 | $181 | 74 |
| 726 W Summer St | 0.35mi | 3/2.0 | 1,421 (+6%) | 3mo | $240,000 | $169 | 68 |
| 914 W Brewster St | 0.34mi | 3/2.0 | 1,444 (+7%) | 2mo | $245,000 | $170 | 66 |
| 731 W Elsie St | 0.66mi | 3/1.5 | 1,344 (0%) | 2mo | $200,000 | $149 | 65 |
| 1019 W Oklahoma St | 0.71mi | 3/1.5 | 1,368 (+2%) | 2mo | $255,000 | $186 | 61 |
| 1314 N Harriman St | 0.23mi | 3/2.0 | 1,540 (+15%) | 2mo | $265,000 | $172 | 59 |
| 225 E Circle St | 0.51mi | 2/1.0 (-1) | 1,462 (+9%) | 1mo | $265,000 | $181 | 56 |
| 109 E Hancock St | 0.68mi | 3/1.5 | 1,258 (-6%) | 0mo | $230,000 | $183 | 55 |
| 727 N Bennett St | 0.61mi | 3/1.0 | 1,497 (+11%) | 1mo | $279,700 | $187 | 52 |
| 923 W Elsie St | 0.72mi | 2/1.0 (-1) | 1,224 (-9%) | 2mo | $210,000 | $172 | 45 |
Match score weights: distance 35% · size 25% · config 20% · recency 20%. Top-matched comps best support the ARV.
Projected returns pro-forma
-3.0% appreciation · 0.67% rent growth · sell at horizon
- IRR
- -17.1%
- Equity multiple
- 0.41×
- Total profit
- $-39,800
- Equity at exit
- $35,770
- IRR
- -13.8%
- Equity multiple
- 0.28×
- Total profit
- $-48,323
- Equity at exit
- $20,742
Cash invested: $67,172 (down + closing). Projections, not guarantees.
Landlord ↔ Tenant lean methodology
- Overall (STATE)
- 73 Landlord-Friendly
- State Wisconsin
- 73 Landlord-Friendly · R+2
- County
- — inherits STATE
- City
- — inherits STATE
ZIP-level market 54911
- Rents YoY
- 0.7%
- Active inventory
- 32
- Price-to-rent
- 9.7×
Monthly cashflow live
- Estimated rent
- $2,060 high interval (Pro) →
- Mortgage (P&I)
- −$1,258
- Tax from tax record
- −$209 /mo · $2,511/yr
- Insurance
- −$100
- HOA
- −$0
- Vacancy / Maint / Mgmt
- −$433
- Net cashflow
- $60
Break-even live
UW: 25.0% down · 7.5% · 30yr · 1.5% tax · 5.0% vac · 8.0% maint · 8.0% mgmt
Financing live
Cash to close
- Down payment
- $59,975
- Closing costs
- $7,197
- Reserves months
- —
- Total cash needed
- —
Loan-product check · same deal, 3 products live
Conventional
25% down · 7.5% · 30yr
- Down + closing
- —
- Monthly P&I
- —
- Monthly cashflow
- —
- DSCR
- —
- Eligible?
- —
Personal DTI + credit; lowest rate.
DSCR
20% down · 8.5% · 30yr
- Down + closing
- —
- Monthly P&I
- —
- Monthly cashflow
- —
- DSCR
- —
- Eligible?
- —
No personal income docs; deal must DSCR.
Hard money
10% down · 12.0% · 12mo
- Down + closing
- —
- Monthly P&I
- —
- Monthly cashflow
- —
- DSCR
- —
- Eligible?
- —
Short-term bridge; refi at stabilization.
Rent comps 23 comps
| Address | Beds | Baths | Sqft | Rent | $/sqft | DOM | Units | Dist |
|---|---|---|---|---|---|---|---|---|
| 1208 N Superior St Unit 1208 LOWER Appleton, WI | 2.0 | 1.0 | 950 | $1,500 | $1.58 | 43d | 1 | 0.39mi |
| 229 W Marquette St Appleton, WI | 4.0 | 1.0 | 1152 | $1,625 | $1.41 | 44d | 1 | 0.41mi |
| 1114 N Superior St Unit 2 Appleton, WI | 2.0 | 1.0 | 900 | $900 | $1.00 | 13d | 1 | 0.42mi |
| 806 N Richmond St Appleton, WI | 4.0 | 1.5 | 1260 | $2,695 | $2.14 | 21d | 1 | 0.56mi |
| 1006 W Spring St Appleton, WI | 2.0 | 1.0 | 900 | $2,250 | $2.50 | 43d | 1 | 0.56mi |
| 826 W Elsie St Appleton, WI | 4.0 | 2.0 | 1328 | $1,800 | $1.36 | 21d | 1 | 0.70mi |
| 1115 N Mason St Appleton, WI | 3.0 | 2.0 | 1664 | $1,495 | $0.90 | 13d | 1 | 0.75mi |
| 517 N Morrison St Appleton, WI | 3.0 | 1.5 | 1400 | $1,495 | $1.07 | 13d | 1 | 0.85mi |
| 701 E Longview Dr Unit 701 Appleton, WI | 3.0 | 1.5 | 1400 | $1,700 | $1.21 | 21d | 1 | 1.02mi |
| 1207 W Ridgeview Dr Unit 1061620P Appleton, WI | 3.0 | 1.5 | 1399 | $6,950 | $4.97 | 21d | 1 | 1.04mi |
| 1209 W Ridgeview Dr Unit 1061635P Appleton, WI | 3.0 | 1.5 | 1399 | $5,014 | $3.58 | 13d | 1 | 1.04mi |
| 2409 N Eugene St Unit 1 Appleton, WI | 2.0 | 2.0 | 1000 | $1,400 | $1.40 | 13d | 1 | 1.09mi |
| 807 E Atlantic St Appleton, WI | 3.0 | 1.0 | 960 | $1,799 | $1.87 | 21d | 1 | 1.11mi |
| 105 W College Ave Appleton, WI | 1.0–2.0 | 1.0–2.0 | 843 | $1,975 | $2.34 | 13d | 15 | 1.12mi |
| 118 N Durkee St Appleton, WI | 1.0–2.0 | 1.0–2.0 | 849 | $1,850 | $2.18 | 13d | 3 | 1.12mi |
| 320 E College Ave Unit 307 Appleton, WI | 3.0 | 2.0 | 1525 | $2,500 | $1.64 | 43d | 1 | 1.17mi |
| 320 E College Ave Unit 603 Appleton, WI | 2.0 | 2.0 | 1592 | $2,995 | $1.88 | 43d | 1 | 1.17mi |
| 320 E College Ave Unit 204 Appleton, WI | 2.0 | 2.0 | 1298 | $2,500 | $1.93 | 21d | 1 | 1.17mi |
| 320 E College Ave Unit 208 Appleton, WI | 2.0 | 2.0 | 1443 | $2,400 | $1.66 | 43d | 1 | 1.17mi |
| 217 S Badger Ave Unit 1387451P Appleton, WI | 3.0 | 2.0 | 1194 | $3,470 | $2.91 | 13d | 1 | 1.21mi |
| 228 N Rankin St Unit 1061616P Appleton, WI | 2.0 | 1.0 | 1097 | $6,795 | $6.19 | 13d | 1 | 1.36mi |
| 2130 W Russet Ct Appleton, WI | 1.0–2.0 | 1.0 | 900 | $1,270 | $1.41 | 13d | 1 | 1.38mi |
| 609 S State St Unit 1061651P Appleton, WI | 4.0 | 2.5 | 1593 | $3,236 | $2.03 | 43d | 1 | 1.39mi |
Listing history 20 events
-
2026-06-19days on market $239,900 Active 28 DOM
-
2026-06-18days on market $239,900 Active 27 DOM
-
2026-06-17days on market $239,900 Active 26 DOM
-
2026-06-16price $239,900 Active 25 DOM
-
2026-06-16days on market $249,900 Active 25 DOM
-
2026-06-15days on market $249,900 Active 24 DOM
-
2026-06-14days on market $249,900 Active 22 DOM
-
2026-06-13days on market $249,900 Active 21 DOM
-
2026-06-10days on market $249,900 Active 19 DOM
-
2026-06-09days on market $249,900 Active 18 DOM
-
2026-06-08days on market $249,900 Active 17 DOM
-
2026-06-07days on market $249,900 Active 16 DOM
-
2026-06-05days on market $249,900 Active 13 DOM
-
2026-06-03days on market $249,900 Active 12 DOM
-
2026-06-02days on market $249,900 Active 11 DOM
-
2026-06-01days on market $249,900 Active 10 DOM
-
2026-05-31days on market $249,900 Active 9 DOM
-
2026-05-30days on market $249,900 Active 8 DOM
-
2026-05-22$249,900 Active
-
2007-01-02soldstatus $96,700
ⓘ Source: listings_history table (triggers on properties + properties_extension) + one-shot
backfill from property_details.listing_events for pre-trigger history.
Tax reassessment forecast WI · Partial reset (capped growth)
- Current annual tax
- $2,511 · $209/mo
- Projected year-2 tax
- $3,475 · $290/mo
- Expected delta
- +$964/yr (+$80/mo · 38.4%)
ⓘ Screening estimate from a state-policy table — verify with the county assessor before closing.
Climate risk First Street
- Flood 1/10 Low FEMA zone X (unshaded) · 0% chance over 30 yrs
- Wildfire 1/10 Low
- Heat 2/10 Low 7 d/yr ≥97°F today · 12 d/yr by 30 yrs out
- Wind 2/10 Low
- Air quality 3/10 Moderate 2 unhealthy d/yr today · 3 by 30 yrs out
Nearby sold comps map
Loading sold comps map…
Walkable amenities ~0.75 mi
Loading nearby amenities…
Taxation est. · year 1
- Rental income
- $24,717
- − Mortgage interest
- −$13,438
- − Property taxes
- −$2,511
- − Insurance
- −$1,200
- − Repairs & maintenance
- −$1,977
- − Management
- −$1,977
- − Depreciation
- −$6,979
- Taxable loss
- −$3,365
- Est. tax savings @ 24.0%
- +$808
- After-tax cash flow
- $1,527/yr
For passive investors: Depreciation is non-cash, so a rental often shows a tax loss while cash-flowing — sheltering income. Rental losses are passive: they offset passive income freely, and up to $25,000/yr can offset ordinary (W-2) income if you actively participate and your MAGI is under $100k (phasing out to $0 by $150k); unused losses carry forward. On sale, claimed depreciation is recaptured at up to 25%, and gains may owe capital-gains tax (a 1031 exchange can defer both). Figures are a year-1 estimate at your 24.0% rate — not tax advice; consult a CPA.
Schools (NCES district)
- District
- Appleton Area School District
- NCES district ID
- 5500390
- Math proficiency
- 33% ▼ -6.00%
- Reading proficiency
- 36% ▼ -1.00%
- Median HH income
- $53,892
- Composite
- 30.3/100
- National rank
- #6279
- State rank
- #224 of 342 in WI
Livability — Appleton
- Score
- 82/100
- State rank
- #44
- US rank
- #1073
Category grades
Schools grade is shown separately in the Schools card above.
Census & demographics
- Census place
- Appleton, WI
- County
- Outagamie County · 155,051 people
- City population
- 126,671
- Metro
- Appleton, WI
- Population (ZIP)
- 25,308
- Household income
- $67,001
- Rent vs Own
- Severe rent burden
- 876.0
Population outlook (Outagamie County) Hauer SSP2
- Today (2025)
- 195,863 people
- By 2030
- 201,154 · +2.7%
- By 2040
- 209,053 · +6.7%
- By 2050
- 211,957 · +8.2%
- By 2075
- 214,299 · +9.4%
- By 2100
- 200,825 · +2.5%
Race, ethnicity, and origin ACS 2023
- Neighborhood character
- Predominantly White (82%)
- Race & ethnicity
- White 82% Hispanic / Latino 7% Two or more races 6% Asian 6% Black 2%
- Hispanic origin (detail)
- Mexican 4% Puerto Rican 1%
- Common ancestry
- Romanian 9% Iranian 5% Portuguese 4%
- Foreign-born
- 6% · Canada, China, Vietnam
- Languages at home
- 90% English-only · Other Asian/Pacific 4% Spanish 3% Chinese 1%
Political lean MEDSL · Outagamie
- 2024 margin
- R (+10.2) · D 44.2% · R 54.4% · Other 1.5%
- 2008→2024 swing
- -21.8pp toward R · 2008: 11.6pp · 2024: -10.2pp
- All cycles
- 2024: R+10.2 2020: R+9.9 2016: R+12.6 2012: R+1.8 2008: D+11.6
Not yet ingested
- Civics
- —
Market trends
- HPI YoY
- ▼ -237.96%
- Current HPI
- 218.9027
- Rent YoY
- ▲ 0.67%
- Metro
- Appleton, WI
- State GDP YoY
- ▲ 2.10%
- F500 in state
- 20
Industry mix (Fortune 500 HQ in WI)
| Industry | F500 HQs | Revenue |
|---|---|---|
| Industrial Machinery | 4 | $23B |
|
||
| Industrial Technology | 2 | $36B |
|
||
| Insurance | 1 | $36B |
|
||
| Professional Services | 1 | $19B |
|
||
| Utilities | 1 | $9B |
|
||
| Consumer Goods | 1 | $3B |
|
||
Price history
+158.4% since first listed2 events — show timeline
- 2026-05-22 Listed $249,900 RANW
- 2007-01-02 Sold (Public Records) $96,700 Public Records
Property tax history
+1.1%/yrLatest (2025): $2,511 · +7.0% YoY. Source: county tax records.
Cash-flow waterfall
monthlySold comps — $/sqft
last 12 mo · ≤1 miLoading sold comps…