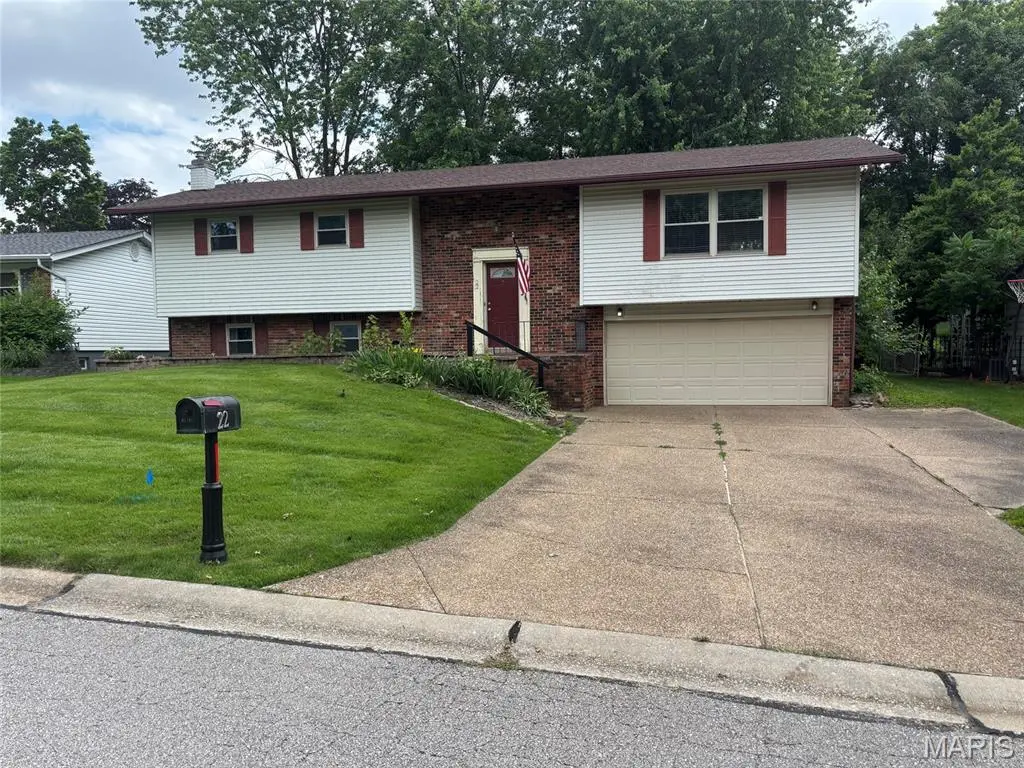
22 Heather Dr
St. Peters, MO 63376
$259,900D+
3 bd · 2.0 ba ·
2,155 sqft ·
Built 1977
· SingleFamily
· Pending
· 9 DOM
Cashflow @ list (25.0% down · 7.5%)
Estimated rent
$2,212/mo
Mortgage (P&I)
−$1,363
Tax + insurance
−$407
HOA
−$0
Vac / Maint / Mgmt
−$464
Net cashflow
$-23/mo
Annual
$-276/yr
Cap rate
6.19%
Cash-on-cash
-0.38%
DSCR
0.98
1% rule
0.85%
Cash to close
$72,772
Investor read
- This is a 3-bed/2.0-bath single-family listed at $260k.
- At list price, monthly cash flow is $-23 ($-276/yr) — negative.
- To cash-flow at today's rent, offer at most $256k (1.6% below list).
- To meet the 1% rule (rent ≥ 1% of price), the offer needs to be $221k (14.9% below list).
- Only 9 days on market — expect competitive offers; lowballing is unlikely to land.
- Recommended offer: $221k (14.9% below list) — sets the bar for 1% rule.
- Local home prices are declining (-3.0%/yr); year-one equity from $2k of loan paydown is wiped out by about $8k of value loss. Plan a longer hold.
- Location reads: area grade D — affects rentability + tenant quality, not the cash-flow math above.
- Ft. Zumwalt R-II (suburban): math 54% / reading 60% proficiency, ranked #14 of 324 in MO (top 4%) — acceptable for families but not a draw, mixed tenant base, ~2y average lease; only 18% free/reduced lunch — higher-income household profile.
- Zoned schools: Hawthorn Elem. (math 44% / reading 50%, grade D-, #347 of 1,115 statewide, top 35%, 463 students, 22% FRL); Ft. Zumwalt East High (math 50% / reading 64%, grade C, #51 of 521 statewide, top 11%, 1,226 students, 25% FRL).
- Market conditions: Rents rising (+2.7%/yr); 290 active listings in the ZIP; 8 comparable units currently listed for rent nearby; rentals leasing fast (median 8d on market — plan ~1-2 weeks tenant-placement turnaround); solid renter incomes; 2,021 units permitted in St. Charles County in 2024 (568 in 5+ unit buildings).
- St. Charles County population projected at +22% by 2050 — long-run rental-demand tailwind backs the buy-and-hold thesis.
- 2 sale attempts since 12y ago; this cycle's ask is 11714% above the opening price — seller raised mid-cycle; expect resistance to lowballs.
- Current owner paid $146k; list at $260k implies a 77% gain — meaningful room to come down on a strong offer.
- Climate carrying-cost: extreme-heat days projected 7→20/yr by 2055 (HVAC capex compounding) — expect insurance premiums to compound above CPI over the hold.
- Cap rate 6.2% vs local median 4.2% in St. Peters — top-decile yield for the area; either an underpriced asset or a hidden risk that comps aren't pricing in. Stress-test before assuming the spread holds.
Questions for listing agent
- What do current leases actually rent for vs. the listed asking? Can we see a recent rent roll and the last 12 months of T-12 income?
- Built in 1977 — when were the roof, HVAC, electrical panel, plumbing, and water heater last replaced?
- Is there a deadline driving the sale (1031 exchange, divorce, estate, relocation)? That informs how much negotiation room exists.
- The area grade is low — what's the realistic commute time and amenity access for the typical tenant pool here? Any planned neighborhood developments (good or bad) we should know about?
- What's the average days-on-market for RENTAL listings here right now (not sales)? A rising rental-DOM trend means longer vacancies and softer asking-rent achievability than the comps imply.
- What's the recent tenant-quality profile in this submarket — average credit score on applications, eviction rate, late-payment / NSF rate, and stable-employment percentage? A property-management company in the area should have these aggregated.
- How much new for-sale + rental construction is in the pipeline within 1–3 miles? Heavy new supply typically softens prices + rents 12–24 months out; constrained supply supports both.
CashFlowRE · CFR-1PA1W8FC9DBS2X
· Data 1 week ago
cashflowre.app · 2026-05-29