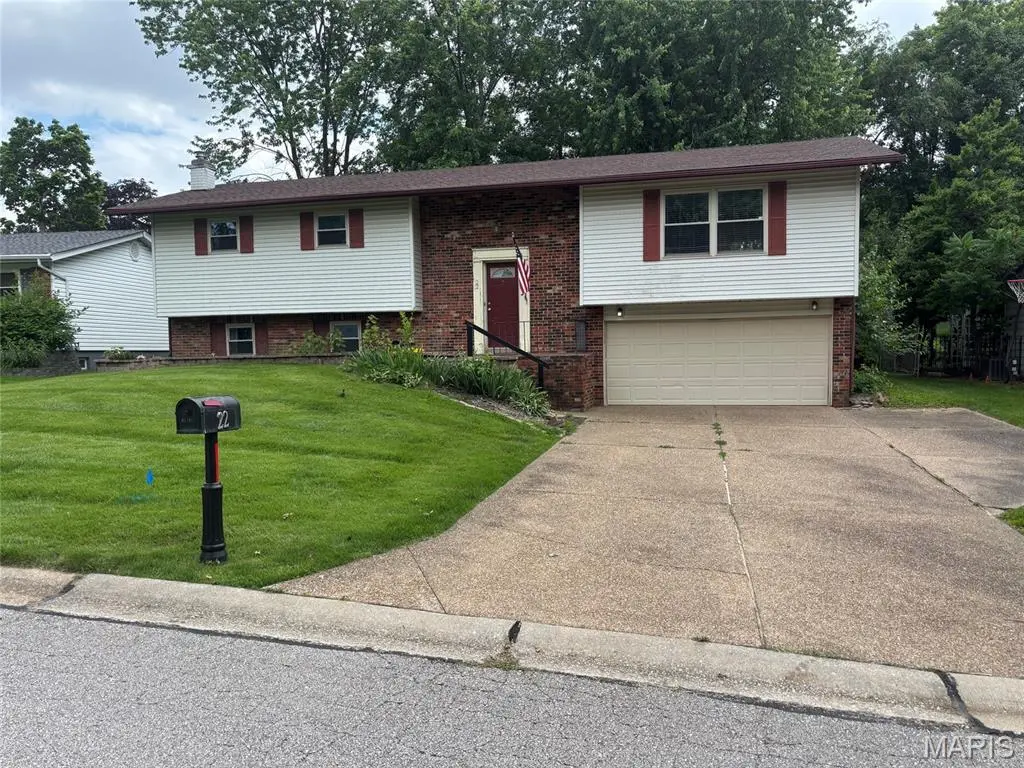
22 Heather Dr · St. Peters, MO
Flood risk 1/10 · Minimal
- FEMA flood zone
- X (unshaded)
- Chance of flooding over 30 yrs
- 0.0%
- Est. flood insurance / yr
- $473 – $860
Fire risk 1/10 · Minimal
- Est. fire insurance / yr
- $1,054 – $1,958
Heat risk 5/10 · Moderate
- Hot days now (above 107°F)
- 7 days/yr
- Hot days in 30 yrs
- 20 days/yr
Wind risk 2/10 · Minimal
- Chance of severe wind over 30 yrs
- 1.0%
Air-quality risk 2/10 · Minimal
- Unhealthy air days now
- 2 days/yr
- Unhealthy air days in 30 yrs
- 2 days/yr
Risk factors via First Street. Map © Google.
Why this score? — see what drove the D+ grade
The composite is a weighted blend of 9 inputs, each scored 0–100. Each bar is that input's sub-score; the figure is the points it added to the 100-point composite (weight × sub-score).
- ARV discount +15.0/15.0
- Cash flow +12.8/30.0
- Schools +5.1/10.0
- DSCR +3.8/10.0
- 1% rule +3.5/10.0
- Rent growth +3.2/5.0
- Livability +2.5/5.0
- Condition / age +2.5/5.0
- Appreciation +0.0/10.0
$259,900
🖨 Deal sheet (PDF) 📄 Offer letter ✓ Due diligence
Listing remarks MLS
"Sellers are offering up to a $4,000 credit for the Buyer's Eligible Closing Cost expenses AND will consider paying $5,000 to replace the roof accompanied by a Qualified Buyer's Offer (pre-approval letter to accompany offer.)" Love the smart floor plan of this 4BR, 2.5 BA home just minutes from Spencer Branch Library & St. Peters Rec Plex. Over-sized aggregate driveway, 2-car garage fits ½ ton truck & car, plus refrigerator, work-bench, & extra storage closet; 12 ft. entry foyer w/coved ceilings, large coat closet, spacious FR & kitchen, huge walk-out deck; fenced level backyard, privacy tree line & garden; walk-in greenhouse; Great Western 10X12X10ft & Rubbermaid 84X85X95" sheds; gorgeous brick WB FPLC; Recreation area w/2nd family room & 1/2BA in LL; over-sized laundry & utility area w/built-in storage shelves ceiling to floor; Master has full bath & large walk-in closet. Beautiful drive to & from home complements surroundings in desirable neighborhood. Home Warranty included.
Key facts
- 9,374 sq ft lot
- 2 garage spots
- Built 1977
Property features AI
Exterior
- Parking: Attached 2-car garage
- Utilities: Public water; Public sewer; Electricity (single phase); Natural gas connected
- Home design: Single-family residence; Multi/split levels
- Construction: Brick veneer and vinyl siding exterior
- Exterior features: Front and back yard; Some trees; Back-yard fencing
Interior
- Kitchen: Kitchen on main level
- Bedrooms: 4 bedrooms (all on the main level)
- Bathrooms: 2 full bathrooms; 1 half bathroom
- Heating & cooling: Forced-air heating (natural gas); Central air conditioning (electric)
- Interior features: Finished daylight/lookout basement; Storage room; Recreation room; Family room; Fireplace (wood-burning)
- Laundry & utility: Main-level laundry; Utility connections: electricity and natural gas
Neighborhood map
What this means for you Summary
Snapshot
- This is a 3-bed/2.0-bath single-family listed at $260k.
Deal economics
- At list price, monthly cash flow is $-23 ($-276/yr) — negative.
- To cash-flow at today's rent, offer at most $256k (1.6% below list).
- To meet the 1% rule (rent ≥ 1% of price), the offer needs to be $221k (14.9% below list).
- Recommended offer: $221k (14.9% below list) — sets the bar for 1% rule.
- Cap rate 6.2% vs local median 4.2% in St. Peters — top-decile yield for the area; either an underpriced asset or a hidden risk that comps aren't pricing in. Stress-test before assuming the spread holds.
Location & tenants
- Location reads: area grade D — affects rentability + tenant quality, not the cash-flow math above.
- Ft. Zumwalt R-II (suburban): math 54% / reading 60% proficiency, ranked #14 of 324 in MO (top 4%) — acceptable for families but not a draw, mixed tenant base, ~2y average lease; only 18% free/reduced lunch — higher-income household profile.
- Zoned schools: Hawthorn Elem. (math 44% / reading 50%, grade D-, #347 of 1,115 statewide, top 35%, 463 students, 22% FRL); Ft. Zumwalt East High (math 50% / reading 64%, grade C, #51 of 521 statewide, top 11%, 1,226 students, 25% FRL).
- Market conditions: Rents rising (+2.7%/yr); 290 active listings in the ZIP; 8 comparable units currently listed for rent nearby; rentals leasing fast (median 8d on market — plan ~1-2 weeks tenant-placement turnaround); solid renter incomes; 2,021 units permitted in St. Charles County in 2024 (568 in 5+ unit buildings).
Forward outlook
- Local home prices are declining (-3.0%/yr); year-one equity from $2k of loan paydown is wiped out by about $8k of value loss. Plan a longer hold.
- St. Charles County population projected at +22% by 2050 — long-run rental-demand tailwind backs the buy-and-hold thesis.
Negotiation context
- Only 9 days on market — expect competitive offers; lowballing is unlikely to land.
- 2 sale attempts since 12y ago; this cycle's ask is 11714% above the opening price — seller raised mid-cycle; expect resistance to lowballs.
- Current owner paid $146k; list at $260k implies a 77% gain — meaningful room to come down on a strong offer.
Risks & watch-outs
- Climate carrying-cost: extreme-heat days projected 7→20/yr by 2055 (HVAC capex compounding) — expect insurance premiums to compound above CPI over the hold.
Questions for the listing agent
- What do current leases actually rent for vs. the listed asking? Can we see a recent rent roll and the last 12 months of T-12 income?
- Built in 1977 — when were the roof, HVAC, electrical panel, plumbing, and water heater last replaced?
- Is there a deadline driving the sale (1031 exchange, divorce, estate, relocation)? That informs how much negotiation room exists.
- The area grade is low — what's the realistic commute time and amenity access for the typical tenant pool here? Any planned neighborhood developments (good or bad) we should know about?
- What's the average days-on-market for RENTAL listings here right now (not sales)? A rising rental-DOM trend means longer vacancies and softer asking-rent achievability than the comps imply.
- What's the recent tenant-quality profile in this submarket — average credit score on applications, eviction rate, late-payment / NSF rate, and stable-employment percentage? A property-management company in the area should have these aggregated.
- How much new for-sale + rental construction is in the pipeline within 1–3 miles? Heavy new supply typically softens prices + rents 12–24 months out; constrained supply supports both.
Investment metrics
- 1% rule
- 0.85% ✗
- Cap rate
- 6.19%
- Cash-on-cash
- -0.38%
- DSCR
- 0.98
- GRM
- 9.8
CMA / ARV
- ARV (on-the-fly)
- $364,195
- Comps found
- 12
Show comp detail 12 sales within ~0.75 mi
| Address | Dist | Beds/Ba | Sqft | Sold | Price | $/sf | Match |
|---|---|---|---|---|---|---|---|
| 404 Kaliedoscope Ln | 0.23mi | 3/2.5 | 2,162 (+0%) | 3mo | $355,000 | $164 | 84 |
| 6 Shadow Creek Dr | 0.29mi | 3/2.0 | 2,170 (+1%) | 3mo | $235,000 | $108 | 82 |
| 145 Universal Dr | 0.31mi | 3/2.5 | 2,140 (-1%) | 1mo | $319,900 | $149 | 82 |
| 57 Lost Dutchman Dr | 0.43mi | 4/2.5 (+1) | 2,112 (-2%) | 0mo | $380,000 | $180 | 70 |
| 26 Vanguard Dr | 0.43mi | 4/2.0 (+1) | 2,048 (-5%) | 2mo | $339,900 | $166 | 64 |
| 1135 Carrington Dr | 0.53mi | 4/2.5 (+1) | 2,128 (-1%) | 2mo | $359,000 | $169 | 64 |
| 59 Dogwood Ln | 0.43mi | 4/3.0 (+1) | 2,264 (+5%) | 1mo | $385,000 | $170 | 62 |
| 1607 Enwood Dr | 0.34mi | 4/2.0 (+1) | 1,896 (-12%) | 2mo | $329,900 | $174 | 58 |
| 1106 Holly Springs Trl | 0.63mi | 3/3.0 | 2,254 (+5%) | 3mo | $365,000 | $162 | 56 |
| 47 Julie Ln | 0.74mi | 4/3.0 (+1) | 2,268 (+5%) | 0mo | $329,900 | $145 | 47 |
| 501 Summerwood Ct | 0.71mi | 4/3.0 (+1) | 2,014 (-6%) | 2mo | $349,900 | $174 | 46 |
| 1108 Mendoza Dr | 0.70mi | 3/2.5 | 1,847 (-14%) | 3mo | $319,000 | $173 | 39 |
Match score weights: distance 35% · size 25% · config 20% · recency 20%. Top-matched comps best support the ARV.
Projected returns pro-forma
-3.0% appreciation · 2.69% rent growth · sell at horizon
- IRR
- -17.3%
- Equity multiple
- 0.39×
- Total profit
- $-44,249
- Equity at exit
- $38,752
- IRR
- -9.8%
- Equity multiple
- 0.41×
- Total profit
- $-43,149
- Equity at exit
- $22,471
Cash invested: $72,772 (down + closing). Projections, not guarantees.
Landlord ↔ Tenant lean methodology
- Overall (STATE)
- 81 Strongly Landlord-Friendly
- State Missouri
- 81 Strongly Landlord-Friendly · R+10
- County
- — inherits STATE
- City
- — inherits STATE
ZIP-level market 63376
- Rents YoY
- 2.7%
- Active inventory
- 290
- Price-to-rent
- 9.8×
Monthly cashflow live
- Estimated rent
- $2,212 high interval (Pro) →
- Mortgage (P&I)
- −$1,363
- Tax from tax record
- −$299 /mo · $3,588/yr
- Insurance
- −$108
- HOA
- −$0
- Vacancy / Maint / Mgmt
- −$464
- Net cashflow
- $-23
Break-even live
Sensitivity live
| Price | -10% $124 | -5% $51 | +0% $-23 | +5% $-97 | +10% $-170 |
|---|---|---|---|---|---|
| Rent | -10% $-198 | -5% $-110 | +0% $-23 | +5% $64 | +10% $152 |
| Rate | -1.0pp $108 | -0.5pp $43 | base $-23 | +0.5pp $-90 | +1.0pp $-159 |
UW: 25.0% down · 7.5% · 30yr · 1.5% tax · 5.0% vac · 8.0% maint · 8.0% mgmt
Financing live
Cash to close
- Down payment
- $64,975
- Closing costs
- $7,797
- Reserves months
- —
- Total cash needed
- —
Loan-product check · same deal, 3 products live
Conventional
25% down · 7.5% · 30yr
- Down + closing
- —
- Monthly P&I
- —
- Monthly cashflow
- —
- DSCR
- —
- Eligible?
- —
Personal DTI + credit; lowest rate.
DSCR
20% down · 8.5% · 30yr
- Down + closing
- —
- Monthly P&I
- —
- Monthly cashflow
- —
- DSCR
- —
- Eligible?
- —
No personal income docs; deal must DSCR.
Hard money
10% down · 12.0% · 12mo
- Down + closing
- —
- Monthly P&I
- —
- Monthly cashflow
- —
- DSCR
- —
- Eligible?
- —
Short-term bridge; refi at stabilization.
Rent comps 8 comps
| Address | Beds | Baths | Sqft | Rent | $/sqft | DOM | Units | Dist |
|---|---|---|---|---|---|---|---|---|
| 895 Delray Dr St Peters, MO | 3.0 | 2.5 | 1643 | $1,750 | $1.07 | 24d | 1 | 0.69mi |
| 18 Duffy Ct Saint Peters, MO | 4.0 | 3.0 | 1546 | $2,300 | $1.49 | 5d | 1 | 0.76mi |
| 43 Plum Tree Dr Saint Peters, MO | 3.0 | 2.0 | 1477 | $2,530 | $1.71 | 4d | 1 | 0.97mi |
| 341 Lemonwood Dr Saint Peters, MO | 4.0 | 2.0 | 1694 | $2,316 | $1.37 | 8d | 1 | 1.16mi |
| 100 Viva Bene Cir St Peters, MO | 1.0–2.0 | 1.5–2.5 | 1173 | $3,306 | $2.82 | 2d | 23 | 1.16mi |
| 4038 N Bridge Dr Saint Peters, MO | 4.0 | 2.0 | 1864 | $2,595 | $1.39 | 12d | 1 | 1.26mi |
| 418 Willott Square Dr Saint Peters, MO | 2.0 | 3.0 | 1588 | $2,100 | $1.32 | 2d | 1 | 1.26mi |
| 4 Oak Park Dr Saint Peters, MO | 4.0 | 2.5 | 2899 | $2,400 | $0.83 | 44d | 1 | 1.31mi |
Listing history 16 events
-
2026-06-07pricestatusdays on market $259,900 Pending 9 DOM
-
2026-06-03days on market $289,900 Active 7 DOM
-
2026-06-02days on market $289,900 Active 6 DOM
-
2026-06-01days on market $289,900 Active 5 DOM
-
2026-05-31days on market $289,900 Active 4 DOM
-
2026-05-27historical $289,900
-
2025-05-03historical $2,200
-
2025-05-01$2,200
-
2014-06-30soldstatus $146,500
-
2014-06-25soldstatus 1059-char remark
Show marketing remark (1059 chars)
"Sellers are offering up to a $4,000 credit for the Buyer's Eligible Closing Cost expenses AND will consider paying $5,000 to replace the roof accompanied by a Qualified Buyer's Offer (pre-approval letter to accompany offer.)" Love the smart floor plan of this 4BR, 2.5 BA home just minutes from Spencer Branch Library & St. Peters Rec Plex. Over-sized aggregate driveway, 2-car garage fits ½ ton truck & car, plus refrigerator, work-bench, & extra storage closet; 12 ft. entry foyer w/coved ceilings, large coat closet, spacious FR & kitchen, huge walk-out deck; fenced level backyard, privacy tree line & garden; walk-in greenhouse; Great Western 10X12X10ft & Rubbermaid 84X85X95" sheds; gorgeous brick WB FPLC; Recreation area w/2nd family room & 1/2BA in LL; over-sized laundry & utility area w/built-in storage shelves ceiling to floor; Master has full bath & large walk-in closet. Beautiful drive to & from home complements surroundings in desirable neighborhood. Home Warranty included.
-
2014-04-06$146,519 1059-char remark
Show marketing remark (1059 chars)
"Sellers are offering up to a $4,000 credit for the Buyer's Eligible Closing Cost expenses AND will consider paying $5,000 to replace the roof accompanied by a Qualified Buyer's Offer (pre-approval letter to accompany offer.)" Love the smart floor plan of this 4BR, 2.5 BA home just minutes from Spencer Branch Library & St. Peters Rec Plex. Over-sized aggregate driveway, 2-car garage fits ½ ton truck & car, plus refrigerator, work-bench, & extra storage closet; 12 ft. entry foyer w/coved ceilings, large coat closet, spacious FR & kitchen, huge walk-out deck; fenced level backyard, privacy tree line & garden; walk-in greenhouse; Great Western 10X12X10ft & Rubbermaid 84X85X95" sheds; gorgeous brick WB FPLC; Recreation area w/2nd family room & 1/2BA in LL; over-sized laundry & utility area w/built-in storage shelves ceiling to floor; Master has full bath & large walk-in closet. Beautiful drive to & from home complements surroundings in desirable neighborhood. Home Warranty included.
-
2001-03-09soldstatus $118,000
-
1992-09-01soldstatus $77,071
-
1991-12-01soldstatus
-
1991-11-01soldstatus
-
1990-03-01soldstatus
ⓘ Source: listings_history table (triggers on properties + properties_extension) + one-shot
backfill from property_details.listing_events for pre-trigger history.
Tax reassessment forecast MO · Resets to sale price
- Current annual tax
- $3,588 · $299/mo
- Projected year-2 tax
- $3,588 · $299/mo
- Expected delta
- $0/yr ($0/mo · 0.0%)
ⓘ Screening estimate from a state-policy table — verify with the county assessor before closing.
Climate risk First Street
- Flood 1/10 Low FEMA zone X (unshaded) · 0% chance over 30 yrs
- Wildfire 1/10 Low
- Heat 5/10 Major 7 d/yr ≥107°F today · 20 d/yr by 30 yrs out
- Wind 2/10 Low 100% chance of damaging wind over 30 yrs
- Air quality 2/10 Low 2 unhealthy d/yr today · 2 by 30 yrs out
Nearby sold comps map
Loading sold comps map…
Walkable amenities ~0.75 mi
Loading nearby amenities…
Taxation est. · year 1
- Rental income
- $26,540
- − Mortgage interest
- −$14,558
- − Property taxes
- −$3,588
- − Insurance
- −$1,300
- − Repairs & maintenance
- −$2,123
- − Management
- −$2,123
- − Depreciation
- −$7,561
- Taxable loss
- −$4,713
- Est. tax savings @ 24.0%
- +$1,131
- After-tax cash flow
- $855/yr
For passive investors: Depreciation is non-cash, so a rental often shows a tax loss while cash-flowing — sheltering income. Rental losses are passive: they offset passive income freely, and up to $25,000/yr can offset ordinary (W-2) income if you actively participate and your MAGI is under $100k (phasing out to $0 by $150k); unused losses carry forward. On sale, claimed depreciation is recaptured at up to 25%, and gains may owe capital-gains tax (a 1031 exchange can defer both). Figures are a year-1 estimate at your 24.0% rate — not tax advice; consult a CPA.
Schools (NCES district)
- District
- Ft. Zumwalt R-II
- NCES district ID
- 2908370
- Math proficiency
- 54% ▼ -7.00%
- Reading proficiency
- 60% ▼ -4.00%
- Median HH income
- $75,817
- Composite
- 51.04/100
- National rank
- #1772
- State rank
- #14 of 324 in MO
Livability — St. Peters
No livability data for this city. (Only ~50 U.S. cities are tracked.)
Census & demographics
- Census place
- St. Peters, MO
- County
- Saint Charles County · 399,703 people
- City population
- 74,876
- Metro
- St. Louis, MO-IL
- Population (ZIP)
- 74,962
- Household income
- $96,393
- Rent vs Own
- Severe rent burden
- 964.0
Population outlook (St. Charles County) Hauer SSP2
- Today (2025)
- 437,857 people
- By 2030
- 461,707 · +5.4%
- By 2040
- 503,222 · +14.9%
- By 2050
- 534,684 · +22.1%
- By 2075
- 597,047 · +36.4%
- By 2100
- 609,682 · +39.2%
Race, ethnicity, and origin ACS 2023
- Neighborhood character
- Predominantly White (86%)
- Race & ethnicity
- White 86% Two or more races 6% Black 5% Hispanic / Latino 2% Asian 2%
- Common ancestry
- Lithuanian 3% Romanian 3% Italian 2%
- Foreign-born
- 3% · China, Canada
- Languages at home
- 96% English-only · Spanish 1% Chinese 1% Other Asian/Pacific 1%
Political lean MEDSL · St. Charles
- 2024 margin
- R (+17.0) · D 40.8% · R 57.8% · Other 1.4%
- 2008→2024 swing
- -7.2pp toward R · 2008: -9.7pp · 2024: -17.0pp
- All cycles
- 2024: R+17.0 2020: R+17.5 2016: R+26.4 2012: R+21.0 2008: R+9.7
Not yet ingested
- Civics
- —
Market trends
- HPI YoY
- ▼ -315.50%
- Current HPI
- 230.3362
- Rent YoY
- ▲ 2.69%
- Metro
- St. Louis, MO-IL
- State GDP YoY
- ▲ 1.84%
- F500 in state
- 20
Industry mix (Fortune 500 HQ in MO)
| Industry | F500 HQs | Revenue |
|---|---|---|
| Healthcare | 1 | $163B |
|
||
| Insurance | 1 | $21B |
|
||
| Industrial Technology | 1 | $17B |
|
||
| Retail | 1 | $16B |
|
||
| Industrial Distribution | 1 | $10B |
|
||
| Utilities | 1 | $9B |
|
||
Price history
+276.1% since first listed11 events — show timeline
- 2026-05-27 Coming Soon $289,900 MARIS as Distributed by MLS Grid
- 2025-05-03 Rental Removed $2,200 TENANTTURNER2
- 2025-05-01 Listed for Rent $2,200 TENANTTURNER2
- 2014-06-30 Sold (Public Records) $146,500 Public Records
- 2014-06-25 Sold (MLS) — MARIS as Distributed by MLS Grid
- 2014-04-06 Listed $146,519 MARIS as Distributed by MLS Grid
- 2001-03-09 Sold (Public Records) $118,000 Public Records
- 1992-09-01 Sold (Public Records) $77,071 Public Records
- 1991-12-01 Sold (Public Records) — Public Records
- 1991-11-01 Sold (Public Records) — Public Records
- 1990-03-01 Sold (Public Records) — Public Records
Property tax history
+5.5%/yrLatest (2025): $3,588 · +3.5% YoY. Source: county tax records.
Cash-flow waterfall
monthlySold comps — $/sqft
last 12 mo · ≤1 miLoading sold comps…