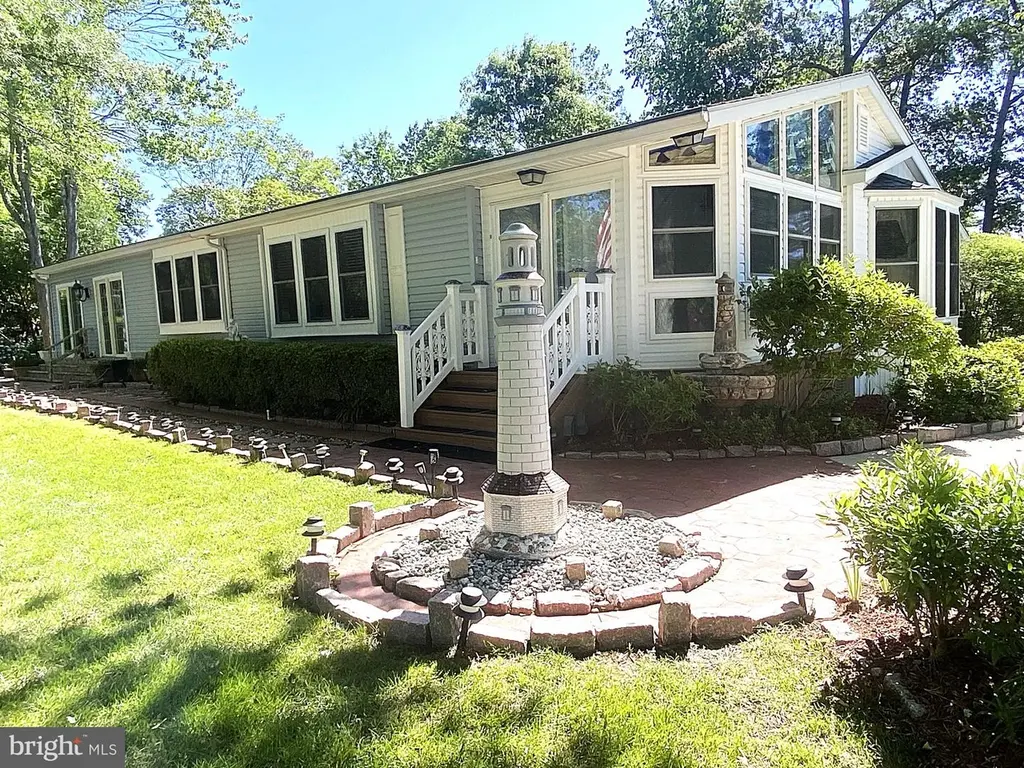
25306 Crab Aly W #1506
Long Neck, DE 19966
$199,000C
3 bd · 2.0 ba ·
2,173 sqft ·
Built 1988
· SingleFamily
· Active
· 16 DOM
Cashflow @ list (25.0% down · 7.5%)
Estimated rent
$2,246/mo
Mortgage (P&I)
−$1,044
Tax + insurance
−$792
HOA
−$0
Vac / Maint / Mgmt
−$472
Net cashflow
$-62/mo
Annual
$-738/yr
Cap rate
8.70%
Cash-on-cash
8.59%
DSCR
1.38
1% rule
1.13%
Cash to close
$55,720
Investor read
- This is a 3-bed/2.0-bath single-family listed at $199k. Condition is rated average.
- At list price, monthly cash flow is $-62 ($-738/yr) — negative.
- To cash-flow at today's rent, offer at most $190k (4.5% below list).
- Meets the 1% rule at list price ($2k rent vs $199k).
- It's been on market 16 days — a 2% lower offer ($196k) is reasonable based on typical stale-listing flexibility.
- Recommended offer: $190k (4.5% below list) — sets the bar for cash-flow.
- Local home prices are declining (-3.0%/yr); year-one equity from $1k of loan paydown is wiped out by about $6k of value loss. Plan a longer hold.
- Location reads 69/100 on livability (#30 in DE) — a middle-class / working-renter tenant base. Strengths: cost of living A+, housing A+, crime A-; Watch: employment D+, schools F, amenities F.
- Indian River School District (rural): math 25% / reading 41% proficiency, ranked #14 of 26 in DE (top 54%) — families likely to look elsewhere, expect single-tenant / working-renter base with shorter leases.
- Watch-outs: flood insurance adds $460/mo.
- Market conditions: 865 active listings in the ZIP; solid renter incomes; 4,354 units permitted in Sussex County in 2024 (344 in 5+ unit buildings).
- Sussex County population projected at +25% by 2050 — long-run rental-demand tailwind backs the buy-and-hold thesis.
- Climate carrying-cost: in FEMA flood zone AE (mandatory federal flood insurance); severe wind risk, 80% chance of damaging wind over 30y; extreme-heat days projected 7→18/yr by 2055 (HVAC capex compounding) — expect insurance premiums to compound above CPI over the hold.
- Cap rate 8.7% vs local median 3.2% in Long Neck — top-decile yield for the area; either an underpriced asset or a hidden risk that comps aren't pricing in. Stress-test before assuming the spread holds.
- This rent runs 34% of the median local income ($78k/yr) — at the standard rent-burdened threshold; future hikes will face affordability resistance.
Questions for listing agent
- What do current leases actually rent for vs. the listed asking? Can we see a recent rent roll and the last 12 months of T-12 income?
- What's the actual annual flood-insurance premium (NFIP or private), and is the property in a SFHA with mandatory coverage?
- Is there a deadline driving the sale (1031 exchange, divorce, estate, relocation)? That informs how much negotiation room exists.
- Schools are F-rated, which usually means shorter tenancies and higher turnover. Who's the typical renter profile here, and what's been the actual vacancy rate?
- What's the average days-on-market for RENTAL listings here right now (not sales)? A rising rental-DOM trend means longer vacancies and softer asking-rent achievability than the comps imply.
- What's the recent tenant-quality profile in this submarket — average credit score on applications, eviction rate, late-payment / NSF rate, and stable-employment percentage? A property-management company in the area should have these aggregated.
- How much new for-sale + rental construction is in the pipeline within 1–3 miles? Heavy new supply typically softens prices + rents 12–24 months out; constrained supply supports both.
Repairs flagged (vision-AI assessment)
- Minor: exterior siding — Light blue siding shows some discoloration
- Minor: interior paint — Painted walls show some wear
- Minor: kitchen cabinets — Standard cabinets show some wear
CashFlowRE · CFR-1QW99CDB689ZX0
· Data 2 days ago
cashflowre.app · 2026-05-29