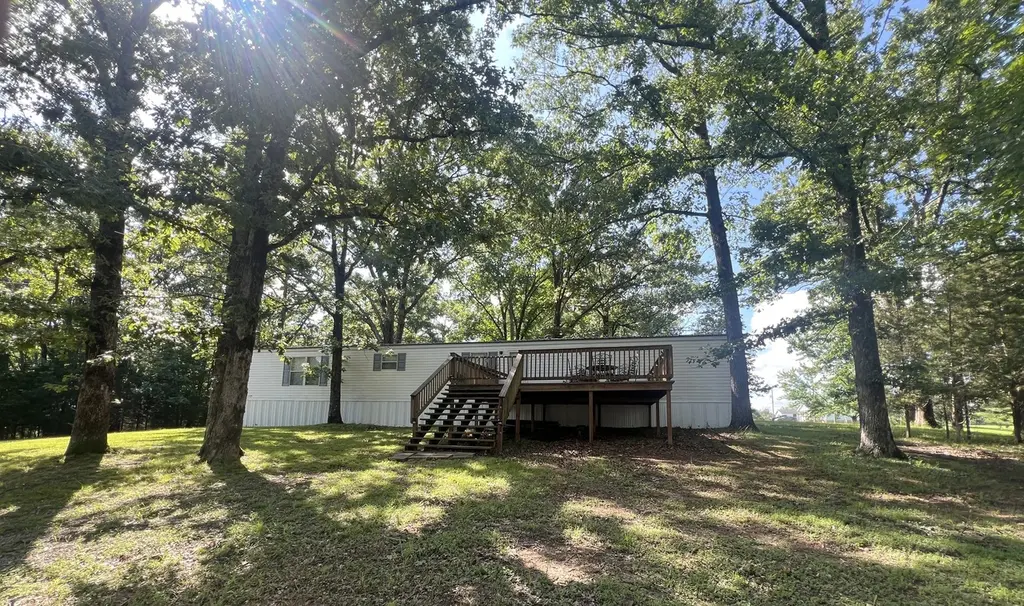
395 Arrowhead Dr
Goreville, IL 62939
$89,000B-
3 bd · 2.0 ba ·
1,152 sqft ·
Built 2005
· SingleFamily
· Pending
· 6 DOM
Cashflow @ list (25.0% down · 7.5%)
Estimated rent
$1,093/mo
Mortgage (P&I)
−$467
Tax + insurance
−$148
HOA
−$0
Vac / Maint / Mgmt
−$230
Net cashflow
$249/mo
Annual
$2,985/yr
Cap rate
9.65%
Cash-on-cash
11.98%
DSCR
1.53
1% rule
1.23%
Cash to close
$24,920
Investor read
- This is a 3-bed/2.0-bath single-family listed at $89k. Condition is rated fair.
- At list price, monthly cash flow is $249 ($3k/yr) — positive.
- The deal already cash-flows at list — no discount required.
- Meets the 1% rule at list price ($1k rent vs $89k).
- Only 6 days on market — expect competitive offers; lowballing is unlikely to land.
- Local home prices are declining (-3.0%/yr); year-one equity from $615 of loan paydown is wiped out by about $3k of value loss. Plan a longer hold.
- Location reads 72/100 on livability (#298 in IL) — a middle-class / working-renter tenant base. Strengths: crime A+, cost of living A+, housing A+; Watch: amenities F, commute F, health & safety F.
- Goreville CUD 1 (rural): math 18% / reading 31% proficiency, ranked #337 of 620 in IL (top 54%) — low school quality limits family demand, transient renter base, plan for 1-2y turnover.
- Zoned schools: Goreville Elementary School (math 17% / reading 32%, grade F, #850 of 2,056 statewide, top 45%, 452 students, 0% FRL); Goreville High School (math 24% / reading 24%, grade F, #256 of 693 statewide, top 44%, 172 students, 0% FRL) — zoned schools average 0% FRL vs 34% district-wide (34 pts lower); this property's tenant base skews higher-income than the district average.
- Market conditions: 58 active listings in the ZIP.
- Johnson County population projected at +4% by 2050 — modest demand growth; plan on rents tracking national, not racing it.
- 5 sale attempts since 10y ago with the ask held roughly flat each time — persistent listings suggest the price (not the market) is what's stuck; bring a comps-based counter.
- Current owner paid $60k; 48% above their basis — modest negotiation headroom, anchor on the comps not their cost.
- At projected returns (-3.0% appreciation + 3.0% rent growth), your $25k cash investment doubles in ~10 years — after that, you're playing with house money.
- Cap rate 9.6% vs local median 1.3% in Goreville — top-decile yield for the area; either an underpriced asset or a hidden risk that comps aren't pricing in. Stress-test before assuming the spread holds.
Questions for listing agent
- Have any recent inspections been done? Can we get a copy of the seller's disclosures and any deferred-maintenance estimates?
- Is there a deadline driving the sale (1031 exchange, divorce, estate, relocation)? That informs how much negotiation room exists.
- Schools are D-rated, which usually means shorter tenancies and higher turnover. Who's the typical renter profile here, and what's been the actual vacancy rate?
- What's the average days-on-market for RENTAL listings here right now (not sales)? A rising rental-DOM trend means longer vacancies and softer asking-rent achievability than the comps imply.
- What's the recent tenant-quality profile in this submarket — average credit score on applications, eviction rate, late-payment / NSF rate, and stable-employment percentage? A property-management company in the area should have these aggregated.
- How much new for-sale + rental construction is in the pipeline within 1–3 miles? Heavy new supply typically softens prices + rents 12–24 months out; constrained supply supports both.
Repairs flagged (vision-AI assessment)
- Minor: kitchen cabinets — dated cabinetry
- Minor: bathroom fixtures — standard fixtures
- Minor: exterior siding — some discoloration
- Minor: interior walls — light-colored walls, some discoloration
- Minor: landscaping — some overgrown grass
CashFlowRE · CFR-1R7M3D82TCD5WJ
· Data 1 week ago
cashflowre.app · 2026-05-29