395 Arrowhead Dr · Goreville, IL
Flood risk 1/10 · Minimal
- FEMA flood zone
- X
- Chance of flooding over 30 yrs
- 0.0%
- Est. flood insurance / yr
- $473 – $860
Fire risk 1/10 · Minimal
- Est. fire insurance / yr
- $804 – $1,492
Heat risk 4/10 · Minor
- Hot days now (above 108°F)
- 7 days/yr
- Hot days in 30 yrs
- 21 days/yr
Wind risk 3/10 · Minor
- Chance of severe wind over 30 yrs
- 4.0%
Air-quality risk 2/10 · Minimal
- Unhealthy air days now
- 1 days/yr
- Unhealthy air days in 30 yrs
- 2 days/yr
Risk factors via First Street. Map © Google.
Why this score? — see what drove the B- grade
The composite is a weighted blend of 9 inputs, each scored 0–100. Each bar is that input's sub-score; the figure is the points it added to the 100-point composite (weight × sub-score).
- Cash flow +27.0/30.0
- ARV discount +15.0/15.0
- DSCR +9.3/10.0
- 1% rule +7.3/10.0
- Livability +3.6/5.0
- Rent growth +2.5/5.0
- Schools +2.2/10.0
- Condition / age +2.2/5.0
- Appreciation +0.0/10.0
$89,000
🖨 Deal sheet (PDF) 📄 Offer letter ✓ Due diligence
Listing remarks MLS
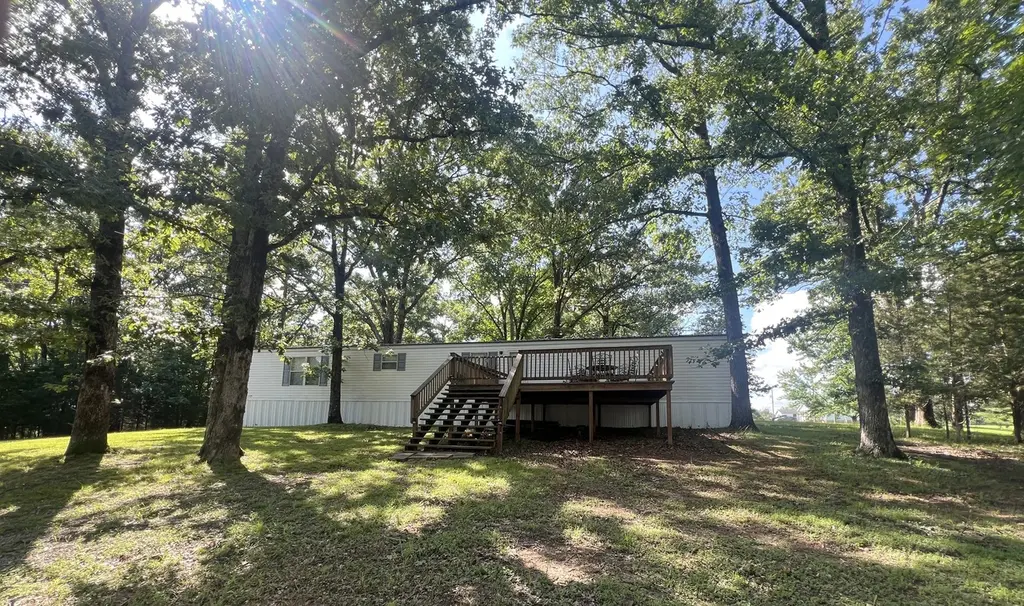
Ready for the lake life? Come check out this great 3 bedroom home. The large, new deck allows for enjoying your coffee or other beverage. Well maintained with newer washer and dryer. Call today for a private showing.
Key facts
- Community boat docks
- Lake rights
- Gated boat ramps
Tags
Property features AI
Finance
- Other: Parcel numbers on file
- HOA & community: No master association fee required; Community amenities include lake access
Exterior
- Parking: Detached garage (2 garage spaces, 2 total parking spaces)
- Utilities: Public water; Public sewer
- Home design: Detached single manufactured home; Fee simple ownership; Age: approximately 21–25 years; Metal roof; Pillar/post/pier foundation
- Construction: Vinyl siding
- Exterior features: Deck; Water view; Water rights
Interior
- Kitchen: Range; Microwave; Dishwasher; Refrigerator; Eating area with island
- Bedrooms: Master bedroom on main level (13 x 15) with full bath; Bedroom on main level (13 x 9); Bedroom on main level (15 x 9)
- Flooring: Carpet in living areas and bedrooms; Ceramic tile in kitchen and laundry
- Bathrooms: Two full bathrooms
- Heating & cooling: Electric heating with heat pump; Central air conditioning
- Interior features: Five total rooms; Kitchen/dining combo; Eating area with island
- Laundry & utility: Main-level laundry (5 x 6) with washer and dryer
Neighborhood map
What this means for you Summary
Snapshot
- This is a 3-bed/2.0-bath single-family listed at $89k. Condition is rated fair.
Deal economics
- At list price, monthly cash flow is $249 ($3k/yr) — positive.
- The deal already cash-flows at list — no discount required.
- Meets the 1% rule at list price ($1k rent vs $89k).
- Cap rate 9.6% vs local median 1.3% in Goreville — top-decile yield for the area; either an underpriced asset or a hidden risk that comps aren't pricing in. Stress-test before assuming the spread holds.
Location & tenants
- Location reads 72/100 on livability (#298 in IL) — a middle-class / working-renter tenant base. Strengths: crime A+, cost of living A+, housing A+; Watch: amenities F, commute F, health & safety F.
- Goreville CUD 1 (rural): math 18% / reading 31% proficiency, ranked #337 of 620 in IL (top 54%) — low school quality limits family demand, transient renter base, plan for 1-2y turnover.
- Zoned schools: Goreville Elementary School (math 17% / reading 32%, grade F, #850 of 2,056 statewide, top 45%, 452 students, 0% FRL); Goreville High School (math 24% / reading 24%, grade F, #256 of 693 statewide, top 44%, 172 students, 0% FRL) — zoned schools average 0% FRL vs 34% district-wide (34 pts lower); this property's tenant base skews higher-income than the district average.
- Market conditions: 58 active listings in the ZIP.
Forward outlook
- Local home prices are declining (-3.0%/yr); year-one equity from $615 of loan paydown is wiped out by about $3k of value loss. Plan a longer hold.
- Johnson County population projected at +4% by 2050 — modest demand growth; plan on rents tracking national, not racing it.
- At projected returns (-3.0% appreciation + 3.0% rent growth), your $25k cash investment doubles in ~10 years — after that, you're playing with house money.
Negotiation context
- Only 6 days on market — expect competitive offers; lowballing is unlikely to land.
- 5 sale attempts since 10y ago with the ask held roughly flat each time — persistent listings suggest the price (not the market) is what's stuck; bring a comps-based counter.
- Current owner paid $60k; 48% above their basis — modest negotiation headroom, anchor on the comps not their cost.
Questions for the listing agent
- Have any recent inspections been done? Can we get a copy of the seller's disclosures and any deferred-maintenance estimates?
- Is there a deadline driving the sale (1031 exchange, divorce, estate, relocation)? That informs how much negotiation room exists.
- Schools are D-rated, which usually means shorter tenancies and higher turnover. Who's the typical renter profile here, and what's been the actual vacancy rate?
- What's the average days-on-market for RENTAL listings here right now (not sales)? A rising rental-DOM trend means longer vacancies and softer asking-rent achievability than the comps imply.
- What's the recent tenant-quality profile in this submarket — average credit score on applications, eviction rate, late-payment / NSF rate, and stable-employment percentage? A property-management company in the area should have these aggregated.
- How much new for-sale + rental construction is in the pipeline within 1–3 miles? Heavy new supply typically softens prices + rents 12–24 months out; constrained supply supports both.
Investment metrics
- 1% rule
- 1.23% ✓
- Cap rate
- 9.65%
- Cash-on-cash
- 11.98%
- DSCR
- 1.53
- GRM
- 6.8
CMA / ARV
- ARV (on-the-fly)
- $148,608
- Comps found
- 3
Show comp detail 3 sales within ~0.75 mi
| Address | Dist | Beds/Ba | Sqft | Sold | Price | $/sf | Match |
|---|---|---|---|---|---|---|---|
| 2255 Eagle Point Bay Rd | 0.67mi | 2/1.5 (-1) | 1,184 (+3%) | 7mo | $153,000 | $129 | 51 |
| 150 John Able Dr | 0.32mi | 2/1.0 (-1) | 1,271 (+10%) | 10mo | $164,200 | $129 | 50 |
| 13537 S Egypt Shores Dr | 0.66mi | 3/1.0 | 1,009 (-12%) | 10mo | $229,000 | $227 | 36 |
Match score weights: distance 35% · size 25% · config 20% · recency 20%. Top-matched comps best support the ARV.
Projected returns pro-forma
-3.0% appreciation · 3.0% rent growth · sell at horizon
- IRR
- 1.5%
- Equity multiple
- 1.06×
- Total profit
- $1,437
- Equity at exit
- $13,270
- IRR
- 11.1%
- Equity multiple
- 1.87×
- Total profit
- $21,717
- Equity at exit
- $7,695
Cash invested: $24,920 (down + closing). Projections, not guarantees.
Landlord ↔ Tenant lean methodology
- Overall (STATE)
- 43 Moderately Tenant-Leaning
- State Illinois
- 43 Moderately Tenant-Leaning · D+7
- County
- — inherits STATE
- City
- — inherits STATE
ZIP-level market 62939
- Home prices YoY
- -17.3%
- Active inventory
- 58
- Price-to-rent
- 6.8×
Monthly cashflow live
- Estimated rent
- $1,093 medium interval (Pro) →
- Mortgage (P&I)
- −$467
- Tax est. 1.5%
- −$111 /mo · $1,335/yr
- Insurance
- −$37
- HOA
- −$0
- Vacancy / Maint / Mgmt
- −$230
- Net cashflow
- $249
Break-even live
Sensitivity live
| Price | -10% $310 | -5% $279 | +0% $249 | +5% $218 | +10% $187 |
|---|---|---|---|---|---|
| Rent | -10% $162 | -5% $206 | +0% $249 | +5% $292 | +10% $335 |
| Rate | -1.0pp $294 | -0.5pp $271 | base $249 | +0.5pp $226 | +1.0pp $202 |
UW: 25.0% down · 7.5% · 30yr · 1.5% tax · 5.0% vac · 8.0% maint · 8.0% mgmt
Financing live
Cash to close
- Down payment
- $22,250
- Closing costs
- $2,670
- Reserves months
- —
- Total cash needed
- —
Loan-product check · same deal, 3 products live
Conventional
25% down · 7.5% · 30yr
- Down + closing
- —
- Monthly P&I
- —
- Monthly cashflow
- —
- DSCR
- —
- Eligible?
- —
Personal DTI + credit; lowest rate.
DSCR
20% down · 8.5% · 30yr
- Down + closing
- —
- Monthly P&I
- —
- Monthly cashflow
- —
- DSCR
- —
- Eligible?
- —
No personal income docs; deal must DSCR.
Hard money
10% down · 12.0% · 12mo
- Down + closing
- —
- Monthly P&I
- —
- Monthly cashflow
- —
- DSCR
- —
- Eligible?
- —
Short-term bridge; refi at stabilization.
Listing history 7 events
-
2026-06-09status $89,000 Pending 6 DOM
-
2026-06-08days on market $89,000 Active 6 DOM
-
2026-06-07days on market $89,000 Active 5 DOM
-
2026-06-05remarks 577-char remark
-
2026-06-05days on market $89,000 Active 2 DOM
-
2026-06-03remarks 452-char remark
-
2026-06-03$89,000 Active 1 DOM
ⓘ Source: listings_history table (triggers on properties + properties_extension) + one-shot
backfill from property_details.listing_events for pre-trigger history.
Climate risk First Street
- Flood 1/10 Low FEMA zone X · 0% chance over 30 yrs
- Wildfire 1/10 Low
- Heat 4/10 Moderate 7 d/yr ≥108°F today · 21 d/yr by 30 yrs out
- Wind 3/10 Moderate 4% chance of damaging wind over 30 yrs
- Air quality 2/10 Low 1 unhealthy d/yr today · 2 by 30 yrs out
Nearby sold comps map
Loading sold comps map…
Walkable amenities ~0.75 mi
Loading nearby amenities…
Taxation est. · year 1
- Rental income
- $13,121
- − Mortgage interest
- −$4,985
- − Property taxes
- −$1,335
- − Insurance
- −$445
- − Repairs & maintenance
- −$1,050
- − Management
- −$1,050
- − Depreciation
- −$2,589
- Taxable income
- $1,667
- Est. tax owed @ 24.0%
- −$400
- After-tax cash flow
- $2,585/yr
For passive investors: Depreciation is non-cash, so a rental often shows a tax loss while cash-flowing — sheltering income. Rental losses are passive: they offset passive income freely, and up to $25,000/yr can offset ordinary (W-2) income if you actively participate and your MAGI is under $100k (phasing out to $0 by $150k); unused losses carry forward. On sale, claimed depreciation is recaptured at up to 25%, and gains may owe capital-gains tax (a 1031 exchange can defer both). Figures are a year-1 estimate at your 24.0% rate — not tax advice; consult a CPA.
Condition & rehab AI · 12 photos
This manufactured home requires moderate repairs and updates to improve its condition and value. The home is located in a desirable area with lake access, but it needs some cosmetic and structural improvements to be move-in ready.
Repairs flagged
- Minor kitchen cabinets — dated cabinetry
- Minor bathroom fixtures — standard fixtures
- Minor exterior siding — some discoloration
- Minor interior walls — light-colored walls, some discoloration
- Minor landscaping — some overgrown grass
Value-add opportunities
- Resale paint interior walls — enhances curb appeal
- Resale replace kitchen cabinets — modernizes kitchen
- Resale repair exterior siding — improves home's appearance
Renovation cost estimate screening
| Repair item | Severity | Est. cost |
|---|---|---|
| kitchen cabinets · dated cabinetry | Minor | $500–3,000 |
| bathroom fixtures · standard fixtures | Minor | $500–3,000 |
| exterior siding · some discoloration | Minor | $500–3,000 |
| interior walls · light-colored walls, some discoloration | Minor | $500–3,000 |
| landscaping · some overgrown grass | Minor | $500–3,000 |
| Total estimated repair cost · 5 items | $2,500–15,000 |
Value-add ROI direction
- Resale paint interior walls — enhances curb appeal ↑
- Resale replace kitchen cabinets — modernizes kitchen ↑
- Resale repair exterior siding — improves home's appearance ↑
ⓘ Cost ranges are severity-bucket heuristics (US national rule-of-thumb). Get contractor quotes + a written scope before underwriting a rehab budget.
Schools (NCES district)
- District
- Goreville CUD 1
- NCES district ID
- 1700014
- Math proficiency
- 18% ▼ -4.00%
- Reading proficiency
- 31% ▼ -13.00%
- Median HH income
- $49,298
- Composite
- 21.52/100
- National rank
- #8317
- State rank
- #337 of 620 in IL
Livability — Goreville
- Score
- 72/100
- State rank
- #298
- US rank
- #5712
Category grades
Schools grade is shown separately in the Schools card above.
Census & demographics
- City population
- 3,072
- Population (ZIP)
- 3,072
Population outlook (Johnson County) Hauer SSP2
- Today (2025)
- 13,355 people
- By 2030
- 13,579 · +1.7%
- By 2040
- 13,849 · +3.7%
- By 2050
- 13,880 · +3.9%
- By 2075
- 13,759 · +3.0%
- By 2100
- 11,536 · -13.6%
Race, ethnicity, and origin ACS 2023
- Neighborhood character
- Predominantly White (92%)
- Race & ethnicity
- White 92% Two or more races 7% Hispanic / Latino 2%
- Common ancestry
- Slovak 6% Danish 4% Romanian 3%
- Foreign-born
- 0%
- Languages at home
- 97% English-only · Spanish 3%
Political lean MEDSL · Johnson
- 2024 margin
- Solid R (+58.3) · D 20.3% · R 78.6% · Other 1.1%
- 2008→2024 swing
- -23.7pp toward R · 2008: -34.6pp · 2024: -58.3pp
- All cycles
- 2024: R+58.3 2020: R+58.6 2016: R+58.3 2012: R+42.1 2008: R+34.6
Not yet ingested
- Civics
- —
Market trends
- HPI YoY
- ▼ -33.34%
- Current HPI
- 159.748
- Rent YoY
- —
- Metro
- —
- State GDP YoY
- ▲ 1.59%
- F500 in state
- 60
Industry mix (Fortune 500 HQ in IL)
| Industry | F500 HQs | Revenue |
|---|---|---|
| Insurance | 4 | $201B |
|
||
| Consumer Goods | 4 | $87B |
|
||
| Industrial Machinery | 3 | $64B |
|
||
| Healthcare | 2 | $55B |
|
||
| Retail / Pharmacy | 1 | $148B |
|
||
| Agriculture / Food | 1 | $86B |
|
||
Price history
+87.4% since first listed10 events — show timeline
- 2026-06-02 Listed $89,000 MRED as Distributed by MLS Grid
- 2021-08-26 Sold (MLS) $60,000 MRED as Distributed by MLS Grid
- 2021-08-26 Sold (MLS) $60,000 RMLSA as Distributed by MLS Grid
- 2021-08-06 Listing Removed — RMLSA as Distributed by MLS Grid
- 2021-06-21 Listed $62,000 MRED as Distributed by MLS Grid
- 2021-06-21 Listed $62,000 RMLSA as Distributed by MLS Grid
- 2017-04-25 Sold (MLS) $44,000 MRED as Distributed by MLS Grid
- 2017-04-25 Sold (MLS) $44,000 RMLSA as Distributed by MLS Grid
- 2016-02-15 Listed $47,500 MRED as Distributed by MLS Grid
- 2016-02-15 Listed $47,500 RMLSA as Distributed by MLS Grid
Cash-flow waterfall
monthlySold comps — $/sqft
last 12 mo · ≤1 miLoading sold comps…