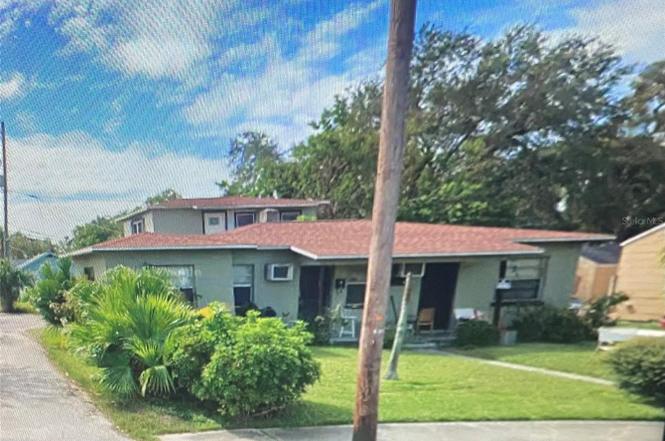
420 Newton Ave S
St. Petersburg, FL 33701
$425,000B-
9 bd · 2.0 ba ·
1,015 sqft ·
Built 1954
· MultiFamily
· Active
· 245 DOM
Cashflow @ list (25.0% down · 7.5%)
Estimated rent
$5,908/mo
Mortgage (P&I)
−$2,229
Tax + insurance
−$806
HOA
−$0
Vac / Maint / Mgmt
−$1,241
Net cashflow
$1,632/mo
Annual
$19,589/yr
Cap rate
12.11%
Cash-on-cash
20.76%
DSCR
1.92
1% rule
1.39%
Cash to close
$119,000
Investor read
- This is a 2×3bd/1.5ba + 1×1bd/1ba units multifamily listed at $425k.
- At list price, monthly cash flow is $2k ($20k/yr) — positive. Per door: $544/mo.
- The deal already cash-flows at list — no discount required.
- Meets the 1% rule at list price ($6k rent vs $425k).
- It's been on market 245 days — a 12% lower offer ($374k) is reasonable based on typical stale-listing flexibility.
- Recommended offer: $374k (12.0% below list) — sets the bar for market timing.
- Local home prices are declining (-3.0%/yr); year-one equity from $3k of loan paydown is wiped out by about $13k of value loss. Plan a longer hold.
- Location reads: area grade B — affects rentability + tenant quality, not the cash-flow math above.
- Pinellas (suburban): math 51% / reading 51% proficiency, ranked #31 of 73 in FL (top 42%) — acceptable for families but not a draw, mixed tenant base, ~2y average lease.
- Watch-outs: flood insurance adds $427/mo; built in 1954 — expect roof / HVAC / electrical / plumbing capex.
- Market conditions: Rents falling (-3.6%/yr); 345 active listings in the ZIP; 2,676 units permitted in Pinellas County in 2024 (1,422 in 5+ unit buildings).
- Pinellas County population projected at +14% by 2050 — modest demand growth; plan on rents tracking national, not racing it.
- 4 sale attempts with the ask held roughly flat each time — persistent listings suggest the price (not the market) is what's stuck; bring a comps-based counter.
- Current owner paid $46k; list at $425k implies a 834% gain — meaningful room to come down on a strong offer.
- Climate carrying-cost: in FEMA flood zone AE (mandatory federal flood insurance); severe wind risk, 99% chance of damaging wind over 30y; extreme-heat days projected 7→26/yr by 2055 (HVAC capex compounding) — expect insurance premiums to compound above CPI over the hold.
- Cap rate 12.1% vs local median 2.6% in St. Petersburg — top-decile yield for the area; either an underpriced asset or a hidden risk that comps aren't pricing in. Stress-test before assuming the spread holds.
- At $5,908/mo this rent would consume 96% of the median local household income ($74k/yr) (locally 2230% of renters already pay >50% of income on rent) — very limited rent-growth headroom before tenants either downsize or default.
Questions for listing agent
- It's been on market 245 days. Have you received any prior offers? Is the seller open to a 12% concession, seller financing, or rate buy-down credit?
- Can we see the unit-by-unit rent roll, current vacancy, and any below-market leases? What's the average tenancy length?
- What capital expenditures (roof, boiler, parking lot, exteriors) have been made in the last 5 years, and what's planned in the next 2?
- Built in 1954 — when were the roof, HVAC, electrical panel, plumbing, and water heater last replaced?
- What's the actual annual flood-insurance premium (NFIP or private), and is the property in a SFHA with mandatory coverage?
- Why hasn't it sold? Are there any deal-killer items the seller is aware of (foundation, flood, title, zoning, code violations)?
- Is there a deadline driving the sale (1031 exchange, divorce, estate, relocation)? That informs how much negotiation room exists.
- What's the average days-on-market for RENTAL listings here right now (not sales)? A rising rental-DOM trend means longer vacancies and softer asking-rent achievability than the comps imply.
CashFlowRE · CFR-1SBNNZ2KKCF8M7
· Data 2 days ago
cashflowre.app · 2026-05-29