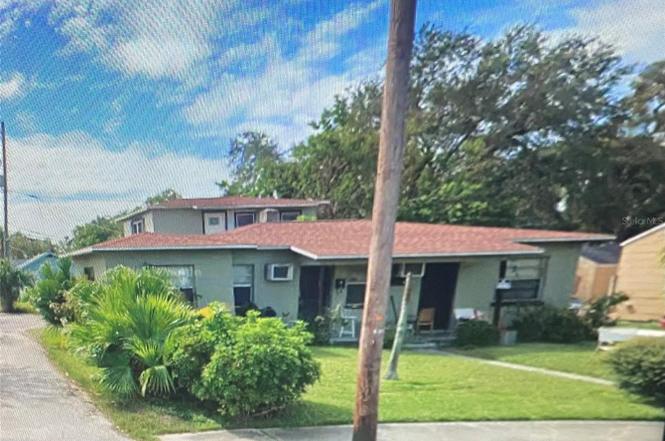
 Triplex
420 Newton Ave S · St. Petersburg, FL
Flood risk 10/10 · Severe
- FEMA flood zone
- AE
- Chance of flooding over 30 yrs
- 0.99%
- Est. flood insurance / yr
- $1,737 – $8,500
Fire risk 1/10 · Minimal
- Est. fire insurance / yr
- $947 – $1,759
Heat risk 10/10 · Severe
- Hot days now (above 106°F)
- 7 days/yr
- Hot days in 30 yrs
- 26 days/yr
Wind risk 10/10 · Severe
- Chance of severe wind over 30 yrs
- 99.0%
Air-quality risk 3/10 · Minor
- Unhealthy air days now
- 2 days/yr
- Unhealthy air days in 30 yrs
- 3 days/yr
Risk factors via First Street. Map © Google.
Why this score? — see what drove the B- grade
The composite is a weighted blend of 9 inputs, each scored 0–100. Each bar is that input's sub-score; the figure is the points it added to the 100-point composite (weight × sub-score).
- Cash flow +30.0/30.0
- 1% rule +10.0/10.0
- DSCR +10.0/10.0
- ARV discount +7.5/15.0
- Schools +4.3/10.0
- Livability +2.5/5.0
- Condition / age +2.5/5.0
- Rent growth +1.6/5.0
- Appreciation +0.0/10.0
$425,000
🖨 Deal sheet 📄 Offer letter ✓ Due diligence
Multi-family units
County records classify this as Multi-Family (2-4 Unit). Listing-text estimate: 3 units. confirmed
Listing remarks
ANOTHER GREAT INCOME PROPERTY THAT HAS A GREAT INCOME OPPORTUNITY IN A AREA THAT IS GROWING AND HAS A STRONG RENTAL DEMAND. THIS IS A BLOCK BUILDING THAT HAS WASHER AND DRYER HOOK-UP. NORTH BUILDING HAS 2 UNITS AND THE SOUTH BUILDING HAS A UPSTAIRS STUDIO WITH AN ATTACHED GARAGE . THIS TRIPLEX IS MINUTES AWAY FROM A VIBRANT DOWN TOWN, SHOPS, MAJOR-HIGHS, AND A BEAUTIFUL PIER WITH A RELAXING WATER VIEW.
Key facts
- Upstairs studio
- Attached garage
- Central air and heat
Tags
Property features AI
Finance
- Other: Total living area reported as 1,431 square feet; Property type listed as Residential Income; Property subtype: Triplex; CDD present
- Financial info: Annual net income reported: $43,200
- HOA & community: Has HOA (no association fees); Senior community; Pets allowed
Exterior
- Parking: Attached garage (1 garage space total)
- Utilities: Private water; Public sewer; Public utilities
- Home design: Residential income property (Triplex); Two buildings on the property
- Construction: Block construction; Shingle roof; Slab foundation; Built on approximately 0.12 acre lot (56 x 90)
- Exterior features: Other exterior features; Asphalt road access
Interior
- Bedrooms: Total of 3 bedrooms (includes units across the triplex)
- Bathrooms: Each unit includes 1 bathroom
- Heating & cooling: Ductless heating; Wall/window cooling units
- Interior features: Ceiling fans
- Laundry & utility: Electric dryer hookup
Neighborhood map
What this means for you Summary
Snapshot
- This is a 3 × 3-bed/3.0-bath units multifamily listed at $425k.
Deal economics
- At list price, monthly cash flow is $2k ($25k/yr) — positive. Per door: $707/mo.
- The deal already cash-flows at list — no discount required.
- Meets the 1% rule at list price ($7k rent vs $425k).
- Recommended offer: $374k (12.0% below list) — sets the bar for market timing.
- Cap rate 13.5% vs local median 2.6% in St. Petersburg — top-decile yield for the area; either an underpriced asset or a hidden risk that comps aren't pricing in. Stress-test before assuming the spread holds.
Location & tenants
- Location reads: area grade B — affects rentability + tenant quality, not the cash-flow math above.
- Pinellas (suburban): math 51% / reading 51% proficiency, ranked #31 of 73 in FL (top 42%) — acceptable for families but not a draw, mixed tenant base, ~2y average lease.
- Market conditions: Rents falling (-3.6%/yr); 345 active listings in the ZIP; 2,676 units permitted in Pinellas County in 2024 (1,422 in 5+ unit buildings).
- At $6,527/mo this rent would consume 107% of the median local household income ($74k/yr) (locally 2230% of renters already pay >50% of income on rent) — very limited rent-growth headroom before tenants either downsize or default.
Forward outlook
- Local home prices are declining (-3.0%/yr); year-one equity from $3k of loan paydown is wiped out by about $13k of value loss. Plan a longer hold.
- Pinellas County population projected at +14% by 2050 — modest demand growth; plan on rents tracking national, not racing it.
- At projected returns (-3.0% appreciation + 0.0% rent growth), your $119k cash investment doubles in ~8 years — after that, you're playing with house money.
Negotiation context
- It's been on market 245 days — a 12% lower offer ($374k) is reasonable based on typical stale-listing flexibility.
- 4 sale attempts with the ask held roughly flat each time — persistent listings suggest the price (not the market) is what's stuck; bring a comps-based counter.
- Current owner paid $46k; list at $425k implies a 834% gain — meaningful room to come down on a strong offer.
Risks & watch-outs
- Watch-outs: flood insurance adds $427/mo; built in 1954 — expect roof / HVAC / electrical / plumbing capex.
- Climate carrying-cost: in FEMA flood zone AE (mandatory federal flood insurance); severe wind risk, 99% chance of damaging wind over 30y; extreme-heat days projected 7→26/yr by 2055 (HVAC capex compounding) — expect insurance premiums to compound above CPI over the hold.
Questions for the listing agent
- It's been on market 245 days. Have you received any prior offers? Is the seller open to a 12% concession, seller financing, or rate buy-down credit?
- Can we see the unit-by-unit rent roll, current vacancy, and any below-market leases? What's the average tenancy length?
- What capital expenditures (roof, boiler, parking lot, exteriors) have been made in the last 5 years, and what's planned in the next 2?
- Built in 1954 — when were the roof, HVAC, electrical panel, plumbing, and water heater last replaced?
- What's the actual annual flood-insurance premium (NFIP or private), and is the property in a SFHA with mandatory coverage?
- Why hasn't it sold? Are there any deal-killer items the seller is aware of (foundation, flood, title, zoning, code violations)?
- Is there a deadline driving the sale (1031 exchange, divorce, estate, relocation)? That informs how much negotiation room exists.
- What's the average days-on-market for RENTAL listings here right now (not sales)? A rising rental-DOM trend means longer vacancies and softer asking-rent achievability than the comps imply.
- What's the recent tenant-quality profile in this submarket — average credit score on applications, eviction rate, late-payment / NSF rate, and stable-employment percentage? A property-management company in the area should have these aggregated.
- How much new apartment / multifamily construction is in the pipeline within 1–3 miles? Heavy new supply (>2% of stock underway) typically softens rents 12–24 months out; light construction supports rent growth.
Investment metrics
- 1% rule
- 1.54% ✓
- Cap rate
- 13.49%
- Cash-on-cash
- 25.69%
- DSCR
- 2.14
- GRM
- 5.4
CMA / ARV
No comps found within radius.
Projected returns pro-forma
-3.0% appreciation · 0.0% rent growth · sell at horizon
- IRR
- 10.4%
- Equity multiple
- 1.40×
- Total profit
- $47,277
- Equity at exit
- $63,369
- IRR
- 16.9%
- Equity multiple
- 2.19×
- Total profit
- $141,872
- Equity at exit
- $36,746
Cash invested: $119,000 (down + closing). Projections, not guarantees.
Landlord ↔ Tenant lean methodology
- Overall (STATE)
- 87 Strongly Landlord-Friendly
- State Florida
- 87 Strongly Landlord-Friendly · R+3
- County
- — inherits STATE
- City
- — inherits STATE
ZIP-level market 33701
- Rents YoY
- -3.6%
- Active inventory
- 345
- Price-to-rent
- 16.3×
Monthly cashflow live
- Estimated rent
- $6,527 medium interval (Pro) →
- Mortgage (P&I)
- −$2,229
- Tax from tax record
- −$203 /mo · $2,430/yr
- Insurance
- −$177
- Flood insurance flood zone
- −$427 /mo · $5,118/yr
- HOA
- −$0
- Vacancy / Maint / Mgmt
- −$1,371
- Net cashflow
- $2,121
Break-even live
3-unit breakdown (identical units grouped — click to expand)
| Units | Beds | Baths | Est. rent |
|---|---|---|---|
| 3× units | 3 | 3 | $6,528 |
| #1 | 3 | 3 | $2,176 |
| #2 | 3 | 3 | $2,176 |
| #3 | 3 | 3 | $2,176 |
| Total (3 units) | $6,527 | ||
UW: 25.0% down · 7.5% · 30yr · 1.5% tax · 5.0% vac · 8.0% maint · 8.0% mgmt
Financing live
Cash to close
- Down payment
- $106,250
- Closing costs
- $12,750
- Reserves months
- —
- Total cash needed
- —
Loan-product check · same deal, 3 products live
Conventional
25% down · 7.5% · 30yr
- Down + closing
- —
- Monthly P&I
- —
- Monthly cashflow
- —
- DSCR
- —
- Eligible?
- —
Personal DTI + credit; lowest rate.
DSCR
20% down · 8.5% · 30yr
- Down + closing
- —
- Monthly P&I
- —
- Monthly cashflow
- —
- DSCR
- —
- Eligible?
- —
No personal income docs; deal must DSCR.
Hard money
10% down · 12.0% · 12mo
- Down + closing
- —
- Monthly P&I
- —
- Monthly cashflow
- —
- DSCR
- —
- Eligible?
- —
Short-term bridge; refi at stabilization.
Listing history 21 events
-
2026-06-18days on market $425,000 Active 245 DOM
-
2026-06-17days on market $425,000 Active 244 DOM
-
2026-06-16days on market $425,000 Active 243 DOM
-
2026-06-15days on market $425,000 Active 242 DOM
-
2026-06-13days on market $425,000 Active 240 DOM
-
2026-06-09days on market $425,000 Active 236 DOM
-
2026-06-08days on market $425,000 Active 235 DOM
-
2026-06-07days on market $425,000 Active 234 DOM
-
2026-06-04days on market $425,000 Active 231 DOM
-
2026-06-03days on market $425,000 Active 230 DOM
-
2026-06-01days on market $425,000 Active 228 DOM
-
2026-05-31days on market $425,000 Active 227 DOM
-
2026-03-07status Active
-
2026-03-06historical
-
2026-02-16status Active
-
2026-01-20status Pending
-
2026-01-20status Active
-
2026-01-20status Pending
-
2025-09-17$425,000 Active
-
1998-01-27soldstatus $45,500
-
1998-01-27soldstatus $45,500
ⓘ Source: listings_history table (triggers on properties + properties_extension) + one-shot
backfill from property_details.listing_events for pre-trigger history.
Tax reassessment forecast FL · Resets to sale price
- Current annual tax
- $2,430 · $203/mo
- Projected year-2 tax
- $3,528 · $294/mo
- Expected delta
- +$1,097/yr (+$91/mo · 45.1%)
ⓘ Screening estimate from a state-policy table — verify with the county assessor before closing.
Climate risk First Street
- Flood 10/10 Extreme FEMA zone AE · 99% chance over 30 yrs
- Wildfire 1/10 Low
- Heat 10/10 Extreme 7 d/yr ≥106°F today · 26 d/yr by 30 yrs out
- Wind 10/10 Extreme 99% chance of damaging wind over 30 yrs
- Air quality 3/10 Moderate 2 unhealthy d/yr today · 3 by 30 yrs out
Nearby sold comps map
Loading sold comps map…
Walkable amenities ~0.75 mi
Loading nearby amenities…
Taxation est. · year 1
- Rental income
- $78,324
- − Mortgage interest
- −$23,807
- − Property taxes
- −$2,430
- − Insurance
- −$7,244
- − Repairs & maintenance
- −$6,266
- − Management
- −$6,266
- − Depreciation
- −$12,364
- Taxable income
- $19,948
- Est. tax owed @ 24.0%
- −$4,788
- After-tax cash flow
- $20,670/yr
For passive investors: Depreciation is non-cash, so a rental often shows a tax loss while cash-flowing — sheltering income. Rental losses are passive: they offset passive income freely, and up to $25,000/yr can offset ordinary (W-2) income if you actively participate and your MAGI is under $100k (phasing out to $0 by $150k); unused losses carry forward. On sale, claimed depreciation is recaptured at up to 25%, and gains may owe capital-gains tax (a 1031 exchange can defer both). Figures are a year-1 estimate at your 24.0% rate — not tax advice; consult a CPA.
Schools (NCES district)
- District
- Pinellas
- NCES district ID
- 1201560
- Math proficiency
- 51% ▼ -5.00%
- Reading proficiency
- 51% ▼ -3.00%
- Median HH income
- $46,270
- Composite
- 43.27/100
- National rank
- #3046
- State rank
- #31 of 73 in FL
Livability — St. Petersburg
No livability data for this city. (Only ~50 U.S. cities are tracked.)
Census & demographics
- Census place
- St. Petersburg, FL
- County
- Pinellas County · 939,478 people
- City population
- 249,151
- Metro
- Tampa-St. Petersburg-Clearwater, FL
- Population (ZIP)
- 18,823
- Household income
- $73,542
- Rent vs Own
- Severe rent burden
- 2230.0
Population outlook (Pinellas County) Hauer SSP2
- Today (2025)
- 1,027,532 people
- By 2030
- 1,063,586 · +3.5%
- By 2040
- 1,125,020 · +9.5%
- By 2050
- 1,168,637 · +13.7%
- By 2075
- 1,265,188 · +23.1%
- By 2100
- 1,260,357 · +22.7%
Race, ethnicity, and origin ACS 2023
- Neighborhood character
- Predominantly White (74%)
- Race & ethnicity
- White 74% Hispanic / Latino 10% Black 10% Two or more races 7% Asian 2%
- Hispanic origin (detail)
- Mexican 1% Puerto Rican 2% Cuban 3%
- Common ancestry
- Romanian 4% Lithuanian 4% Slovak 3%
- Foreign-born
- 10% · Canada, Jamaica, China
- Languages at home
- 88% English-only · Spanish 6% Other Indo-European 2% Russian/Polish/Slavic 1%
Political lean MEDSL · Pinellas
- 2024 margin
- Lean R (+5.2) · D 46.9% · R 52.1%
- 2008→2024 swing
- -13.5pp toward R · 2008: 8.3pp · 2024: -5.2pp
- All cycles
- 2024: R+5.2 2020: D+0.2 2016: R+1.1 2012: D+5.6 2008: D+8.3
Not yet ingested
- Civics
- —
Market trends
- HPI YoY
- ▼ -425.52%
- Current HPI
- 486.3846
- Rent YoY
- ▼ -3.56%
- Metro
- Tampa-St. Petersburg-Clearwater, FL
- State GDP YoY
- ▲ 3.28%
- F500 in state
- 36
Industry mix (Fortune 500 HQ in FL)
| Industry | F500 HQs | Revenue |
|---|---|---|
| Industrial Technology | 2 | $29B |
|
||
| Insurance | 2 | $17B |
|
||
| Retail | 1 | $60B |
|
||
| Technology Distribution | 1 | $58B |
|
||
| Homebuilding | 1 | $35B |
|
||
| Technology Manufacturing | 1 | $35B |
|
||
Price history
+834.1% since first listed9 events — show timeline
- 2026-03-07 Relisted — Stellar MLS as Distributed by MLS Grid
- 2026-03-06 Listing Removed — Stellar MLS as Distributed by MLS Grid
- 2026-02-16 Relisted — Stellar MLS as Distributed by MLS Grid
- 2026-01-20 Pending — Stellar MLS as Distributed by MLS Grid
- 2026-01-20 Relisted — Stellar MLS as Distributed by MLS Grid
- 2026-01-20 Pending — Stellar MLS as Distributed by MLS Grid
- 2025-09-17 Listed $425,000 Stellar MLS as Distributed by MLS Grid
- 1998-01-27 Sold (Public Records) $45,500 Public Records
- 1998-01-27 Sold (Public Records) $45,500 Public Records
Property tax history
+15.8%/yrLatest (2025): $2,430 · +17.7% YoY. Source: county tax records.
Cash-flow waterfall
monthlySold comps — $/sqft
last 12 mo · ≤1 miLoading sold comps…