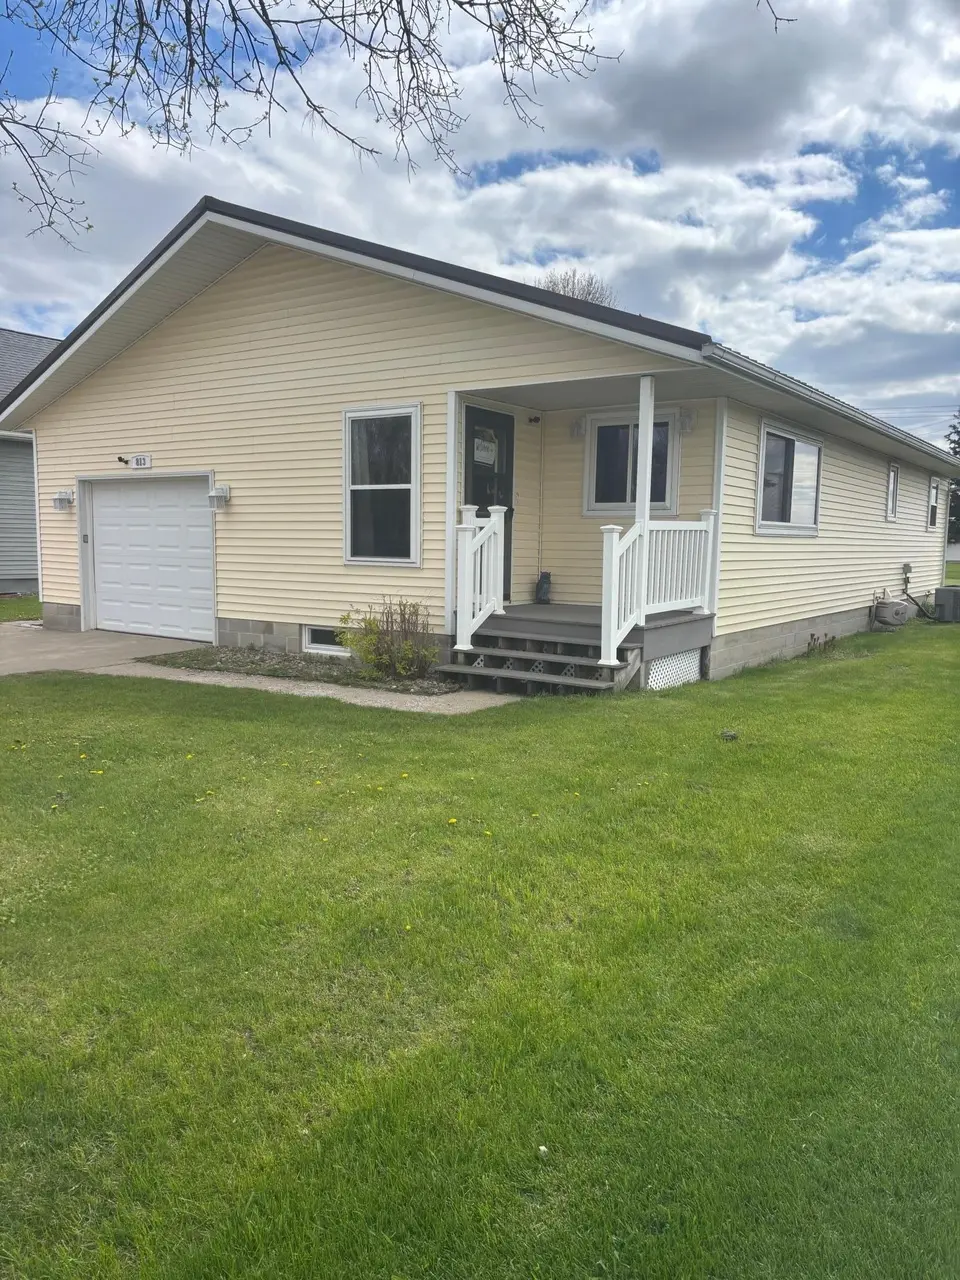
813 2nd St W
Morgan, MN 56266
$169,000C-
3 bd · 1.0 ba ·
3,038 sqft ·
Built 1978
· SingleFamily
· Pending
· 14 DOM
Cashflow @ list (25.0% down · 7.5%)
Estimated rent
$1,442/mo
Mortgage (P&I)
−$886
Tax + insurance
−$240
HOA
−$0
Vac / Maint / Mgmt
−$303
Net cashflow
$13/mo
Annual
$157/yr
Cap rate
6.39%
Cash-on-cash
0.33%
DSCR
1.01
1% rule
0.85%
Cash to close
$47,320
Investor read
- This is a 3-bed/1.0-bath single-family listed at $169k.
- At list price, monthly cash flow is $13 ($157/yr) — positive.
- The deal already cash-flows at list — no discount required.
- To meet the 1% rule (rent ≥ 1% of price), the offer needs to be $144k (14.7% below list).
- Only 14 days on market — expect competitive offers; lowballing is unlikely to land.
- Recommended offer: $144k (14.7% below list) — sets the bar for 1% rule.
- In year one you build about $18k of equity ($1k loan paydown + $17k appreciation (10.0% local appreciation)).
- Location reads 78/100 on livability (#107 in MN, #2,487 nationally) — a middle-class / working-renter tenant base. Strengths: crime A+, cost of living A+, housing A+; Watch: amenities F, commute F.
- Cedar Mountain School District (rural): math 34% / reading 44% proficiency, ranked #229 of 301 in MN (top 76%) — families likely to look elsewhere, expect single-tenant / working-renter base with shorter leases.
- Zoned schools: Cedar Mountain Elementary (math 57% / reading 57%, grade C+, #265 of 857 statewide, top 35%, 194 students, 55% FRL); Cedar Mountain Secondary (math 22% / reading 37%, grade F, #354 of 471 statewide, top 77%, 245 students, 46% FRL) — zoned schools average 51% FRL vs 31% district-wide (20 pts higher); higher-poverty schools than district average — tighter screening recommended.
- Market conditions: 7 active listings in the ZIP; 25 units permitted in Redwood County in 2024 (0 in 5+ unit buildings).
- Redwood County population projected at -16% by 2050 — secular population decline; favor cash flow + early exit over multi-decade hold.
- 2 sale attempts since 8y ago with the ask held roughly flat each time — persistent listings suggest the price (not the market) is what's stuck; bring a comps-based counter.
- Current owner paid $95k; list at $169k implies a 78% gain — meaningful room to come down on a strong offer.
- At projected returns (10.0% appreciation + 3.0% rent growth), your $47k cash investment doubles in ~3 years — after that, you're playing with house money.
- By year 3, paydown + projected appreciation supports a ~$46k cash-out refi (75% LTV) — recoverable capital for the next deal without selling this one.
Questions for listing agent
- Built in 1978 — when were the roof, HVAC, electrical panel, plumbing, and water heater last replaced?
- Is there a deadline driving the sale (1031 exchange, divorce, estate, relocation)? That informs how much negotiation room exists.
- What's the average days-on-market for RENTAL listings here right now (not sales)? A rising rental-DOM trend means longer vacancies and softer asking-rent achievability than the comps imply.
- What's the recent tenant-quality profile in this submarket — average credit score on applications, eviction rate, late-payment / NSF rate, and stable-employment percentage? A property-management company in the area should have these aggregated.
- How much new for-sale + rental construction is in the pipeline within 1–3 miles? Heavy new supply typically softens prices + rents 12–24 months out; constrained supply supports both.
CashFlowRE · CFR-1W5Q3SF4SRT9ES
· Data 4 weeks ago
cashflowre.app · 2026-05-29