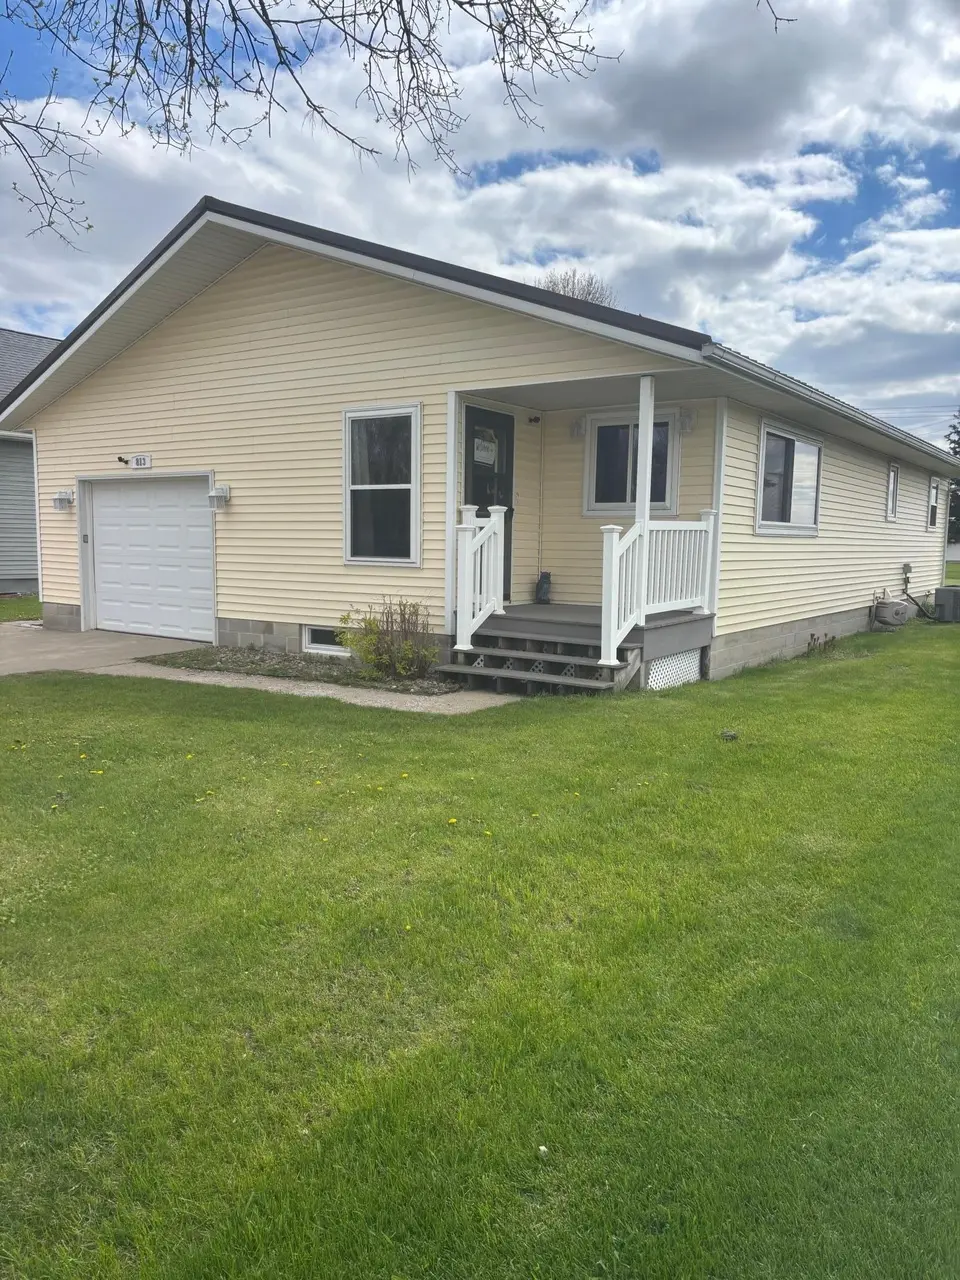
813 2nd St W · Morgan, MN
Flood risk No data
- FEMA flood zone
- —
- Chance of flooding over 30 yrs
- —
- Est. flood insurance / yr
- —
Fire risk No data
- Est. fire insurance / yr
- —
Heat risk No data
- Hot days now (above threshold)
- —
- Hot days in 30 yrs
- —
Wind risk No data
- Chance of severe wind over 30 yrs
- —
Air-quality risk No data
- Unhealthy air days now
- —
- Unhealthy air days in 30 yrs
- —
Risk factors via First Street. Map © Google.
Why this score? — see what drove the C- grade
The composite is a weighted blend of 9 inputs, each scored 0–100. Each bar is that input's sub-score; the figure is the points it added to the 100-point composite (weight × sub-score).
- Cash flow +13.7/30.0
- Appreciation +10.0/10.0
- ARV discount +7.5/15.0
- DSCR +4.1/10.0
- Livability +3.9/5.0
- 1% rule +3.5/10.0
- Schools +3.4/10.0
- Rent growth +2.5/5.0
- Condition / age +2.5/5.0
$169,000
🖨 Deal sheet (PDF) 📄 Offer letter ✓ Due diligence
Listing remarks MLS
Spacious 3 bedroom, 2 bathroom rambler home. Recent updates to include new main level flooring, kitchen counter tops, maintenance free deck and the furnace a few years back. Enjoy the open floor plan that this home has to offer, two bedrooms on the main floor, large open living room and kitchen, family room in the basement and a bathroom on each level.
Key facts
- No rear neighbors
- Main floor laundry
- Combo dining area
Tags
Property features AI
Exterior
- Parking: Attached garage (1 car)
- Utilities: City water (connected); City sewer (connected); Natural gas
- Home design: Residential property; One-level home
- Construction: Block foundation; Asphalt roof
- Exterior features: Deck; Irregular lot (approximately 90x120)
Interior
- Kitchen: Kitchen on the main level
- Bedrooms: Three bedrooms (all on the main level)
- Bathrooms: One full bathroom on the main floor
- Heating & cooling: Forced air heating; Central air conditioning
- Interior features: Full basement; Informal dining area; Main floor bedroom
- Laundry & utility: Laundry on the main level
Neighborhood map
What this means for you Summary
Snapshot
- This is a 3-bed/1.0-bath single-family listed at $169k.
Deal economics
- At list price, monthly cash flow is $13 ($157/yr) — positive.
- The deal already cash-flows at list — no discount required.
- To meet the 1% rule (rent ≥ 1% of price), the offer needs to be $144k (14.7% below list).
- Recommended offer: $144k (14.7% below list) — sets the bar for 1% rule.
Location & tenants
- Location reads 78/100 on livability (#107 in MN, #2,487 nationally) — a middle-class / working-renter tenant base. Strengths: crime A+, cost of living A+, housing A+; Watch: amenities F, commute F.
- Cedar Mountain School District (rural): math 34% / reading 44% proficiency, ranked #229 of 301 in MN (top 76%) — families likely to look elsewhere, expect single-tenant / working-renter base with shorter leases.
- Zoned schools: Cedar Mountain Elementary (math 57% / reading 57%, grade C+, #265 of 857 statewide, top 35%, 194 students, 55% FRL); Cedar Mountain Secondary (math 22% / reading 37%, grade F, #354 of 471 statewide, top 77%, 245 students, 46% FRL) — zoned schools average 51% FRL vs 31% district-wide (20 pts higher); higher-poverty schools than district average — tighter screening recommended.
- Market conditions: 7 active listings in the ZIP; 25 units permitted in Redwood County in 2024 (0 in 5+ unit buildings).
Forward outlook
- In year one you build about $18k of equity ($1k loan paydown + $17k appreciation (10.0% local appreciation)).
- Redwood County population projected at -16% by 2050 — secular population decline; favor cash flow + early exit over multi-decade hold.
- At projected returns (10.0% appreciation + 3.0% rent growth), your $47k cash investment doubles in ~3 years — after that, you're playing with house money.
- By year 3, paydown + projected appreciation supports a ~$46k cash-out refi (75% LTV) — recoverable capital for the next deal without selling this one.
Negotiation context
- Only 14 days on market — expect competitive offers; lowballing is unlikely to land.
- 2 sale attempts since 8y ago with the ask held roughly flat each time — persistent listings suggest the price (not the market) is what's stuck; bring a comps-based counter.
- Current owner paid $95k; list at $169k implies a 78% gain — meaningful room to come down on a strong offer.
Questions for the listing agent
- Built in 1978 — when were the roof, HVAC, electrical panel, plumbing, and water heater last replaced?
- Is there a deadline driving the sale (1031 exchange, divorce, estate, relocation)? That informs how much negotiation room exists.
- What's the average days-on-market for RENTAL listings here right now (not sales)? A rising rental-DOM trend means longer vacancies and softer asking-rent achievability than the comps imply.
- What's the recent tenant-quality profile in this submarket — average credit score on applications, eviction rate, late-payment / NSF rate, and stable-employment percentage? A property-management company in the area should have these aggregated.
- How much new for-sale + rental construction is in the pipeline within 1–3 miles? Heavy new supply typically softens prices + rents 12–24 months out; constrained supply supports both.
Investment metrics
- 1% rule
- 0.85% ✗
- Cap rate
- 6.39%
- Cash-on-cash
- 0.33%
- DSCR
- 1.01
- GRM
- 9.8
CMA / ARV
No comps found within radius.
Projected returns pro-forma
10.0% appreciation · 3.0% rent growth · sell at horizon
- IRR
- 24.5%
- Equity multiple
- 2.96×
- Total profit
- $92,870
- Equity at exit
- $152,249
- IRR
- 21.7%
- Equity multiple
- 6.77×
- Total profit
- $272,824
- Equity at exit
- $328,330
Cash invested: $47,320 (down + closing). Projections, not guarantees.
Landlord ↔ Tenant lean methodology
- Overall (STATE)
- 46 Balanced
- State Minnesota
- 46 Balanced · D+2
- County
- — inherits STATE
- City
- — inherits STATE
ZIP-level market 56266
- Active inventory
- 7
- Price-to-rent
- 9.8×
Monthly cashflow live
- Estimated rent
- $1,442 medium interval (Pro) →
- Mortgage (P&I)
- −$886
- Tax from tax record
- −$170 /mo · $2,036/yr
- Insurance
- −$70
- HOA
- −$0
- Vacancy / Maint / Mgmt
- −$303
- Net cashflow
- $13
Break-even live
Sensitivity live
| Price | -10% $109 | -5% $61 | +0% $13 | +5% $-35 | +10% $-83 |
|---|---|---|---|---|---|
| Rent | -10% $-101 | -5% $-44 | +0% $13 | +5% $70 | +10% $127 |
| Rate | -1.0pp $98 | -0.5pp $56 | base $13 | +0.5pp $-31 | +1.0pp $-75 |
UW: 25.0% down · 7.5% · 30yr · 1.5% tax · 5.0% vac · 8.0% maint · 8.0% mgmt
Financing live
Cash to close
- Down payment
- $42,250
- Closing costs
- $5,070
- Reserves months
- —
- Total cash needed
- —
Loan-product check · same deal, 3 products live
Conventional
25% down · 7.5% · 30yr
- Down + closing
- —
- Monthly P&I
- —
- Monthly cashflow
- —
- DSCR
- —
- Eligible?
- —
Personal DTI + credit; lowest rate.
DSCR
20% down · 8.5% · 30yr
- Down + closing
- —
- Monthly P&I
- —
- Monthly cashflow
- —
- DSCR
- —
- Eligible?
- —
No personal income docs; deal must DSCR.
Hard money
10% down · 12.0% · 12mo
- Down + closing
- —
- Monthly P&I
- —
- Monthly cashflow
- —
- DSCR
- —
- Eligible?
- —
Short-term bridge; refi at stabilization.
Listing history 8 events
-
2026-05-21status Pending
-
2026-05-15historical Contingent - Inspection
-
2026-05-07$169,000 Active
-
2021-05-17soldstatus $95,000
-
2019-02-02historical 356-char remark
Show marketing remark (356 chars)
Spacious 3 bedroom, 2 bathroom rambler home. Recent updates to include new main level flooring, kitchen counter tops, maintenance free deck and the furnace a few years back. Enjoy the open floor plan that this home has to offer, two bedrooms on the main floor, large open living room and kitchen, family room in the basement and a bathroom on each level.
-
2018-10-26soldstatus $90,000 356-char remark
Show marketing remark (356 chars)
Spacious 3 bedroom, 2 bathroom rambler home. Recent updates to include new main level flooring, kitchen counter tops, maintenance free deck and the furnace a few years back. Enjoy the open floor plan that this home has to offer, two bedrooms on the main floor, large open living room and kitchen, family room in the basement and a bathroom on each level.
-
2018-10-17soldstatus $90,000
-
2018-09-03$110,000 356-char remark
Show marketing remark (356 chars)
Spacious 3 bedroom, 2 bathroom rambler home. Recent updates to include new main level flooring, kitchen counter tops, maintenance free deck and the furnace a few years back. Enjoy the open floor plan that this home has to offer, two bedrooms on the main floor, large open living room and kitchen, family room in the basement and a bathroom on each level.
ⓘ Source: listings_history table (triggers on properties + properties_extension) + one-shot
backfill from property_details.listing_events for pre-trigger history.
Tax reassessment forecast MN · Partial reset (capped growth)
- Current annual tax
- $2,036 · $170/mo
- Projected year-2 tax
- $2,036 · $170/mo
- Expected delta
- $0/yr ($0/mo · 0.0%)
ⓘ Screening estimate from a state-policy table — verify with the county assessor before closing.
Nearby sold comps map
Loading sold comps map…
Walkable amenities ~0.75 mi
Loading nearby amenities…
Taxation est. · year 1
- Rental income
- $17,307
- − Mortgage interest
- −$9,467
- − Property taxes
- −$2,036
- − Insurance
- −$845
- − Repairs & maintenance
- −$1,385
- − Management
- −$1,385
- − Depreciation
- −$4,916
- Taxable loss
- −$2,726
- Est. tax savings @ 24.0%
- +$654
- After-tax cash flow
- $811/yr
For passive investors: Depreciation is non-cash, so a rental often shows a tax loss while cash-flowing — sheltering income. Rental losses are passive: they offset passive income freely, and up to $25,000/yr can offset ordinary (W-2) income if you actively participate and your MAGI is under $100k (phasing out to $0 by $150k); unused losses carry forward. On sale, claimed depreciation is recaptured at up to 25%, and gains may owe capital-gains tax (a 1031 exchange can defer both). Figures are a year-1 estimate at your 24.0% rate — not tax advice; consult a CPA.
Schools (NCES district)
- District
- Cedar Mountain School District
- NCES district ID
- 2700110
- Math proficiency
- 34% ▼ -19.00%
- Reading proficiency
- 44% ▼ -14.00%
- Median HH income
- $49,160
- Composite
- 33.55/100
- National rank
- #5426
- State rank
- #229 of 301 in MN
Livability — Morgan
- Score
- 78/100
- State rank
- #107
- US rank
- #2487
Category grades
Schools grade is shown separately in the Schools card above.
Census & demographics
- Census place
- Morgan, MN
- Population (ZIP)
- 1,516
Population outlook (Redwood County) Hauer SSP2
- Today (2025)
- 14,504 people
- By 2030
- 13,983 · -3.6%
- By 2040
- 13,056 · -10.0%
- By 2050
- 12,225 · -15.7%
- By 2075
- 11,051 · -23.8%
- By 2100
- 9,786 · -32.5%
Race, ethnicity, and origin ACS 2023
- Neighborhood character
- Predominantly White (90%)
- Race & ethnicity
- White 90% Two or more races 4% Hispanic / Latino 4% Native American 1%
- Common ancestry
- Portuguese 12% Romanian 2% Lithuanian 1%
- Foreign-born
- 2% · Canada
- Languages at home
- 97% English-only · Spanish 2%
Political lean MEDSL · Redwood
- 2024 margin
- Solid R (+43.3) · D 27.7% · R 71.0% · Other 1.2%
- 2008→2024 swing
- -29.8pp toward R · 2008: -13.6pp · 2024: -43.3pp
- All cycles
- 2024: R+43.3 2020: R+41.2 2016: R+43.0 2012: R+20.1 2008: R+13.6
Not yet ingested
- Civics
- —
Market trends
- HPI YoY
- ▲ 67.58%
- Current HPI
- 210.58
- Rent YoY
- —
- Metro
- —
- State GDP YoY
- ▲ 2.41%
- F500 in state
- 34
Industry mix (Fortune 500 HQ in MN)
| Industry | F500 HQs | Revenue |
|---|---|---|
| Healthcare | 2 | $407B |
|
||
| Retail | 2 | $150B |
|
||
| Consumer Goods | 2 | $32B |
|
||
| Industrial Machinery | 2 | $6B |
|
||
| Agriculture | 1 | $40B |
|
||
| Healthcare / Medical Devices | 1 | $32B |
|
||
Price history
+53.6% since first listed8 events — show timeline
- 2026-05-21 Pending — NORTHSTARMLS as Distributed by MLS Grid
- 2026-05-15 Contingent — NORTHSTARMLS as Distributed by MLS Grid
- 2026-05-07 Listed $169,000 NORTHSTARMLS as Distributed by MLS Grid
- 2021-05-17 Sold (Public Records) $95,000 Public Records
- 2019-02-02 Listing Removed — NORTHSTARMLS as Distributed by MLS Grid
- 2018-10-26 Sold (MLS) $90,000 NORTHSTARMLS as Distributed by MLS Grid
- 2018-10-17 Sold (Public Records) $90,000 Public Records
- 2018-09-03 Listed $110,000 NORTHSTARMLS as Distributed by MLS Grid
Property tax history
+9.0%/yrLatest (2025): $2,036 · +9.2% YoY. Source: county tax records.
Cash-flow waterfall
monthlySold comps — $/sqft
last 12 mo · ≤1 miLoading sold comps…