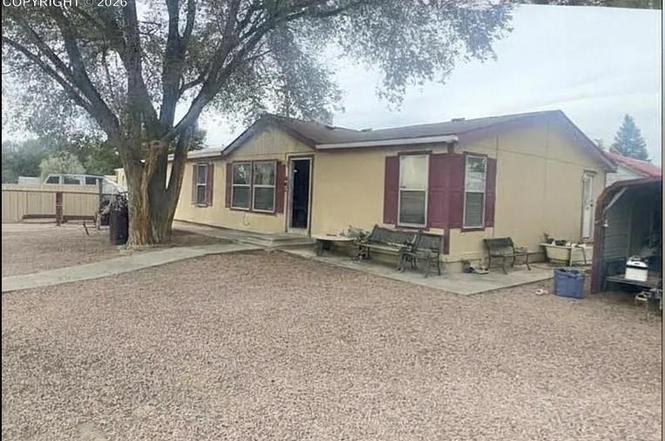
601 North Ln
Avondale, CO 81022
$219,900D
4 bd · 2.0 ba ·
1,418 sqft ·
Built 1998
· Manufactured
· Pending
· 177 DOM
Cashflow @ list (25.0% down · 7.5%)
Estimated rent
$1,652/mo
Mortgage (P&I)
−$1,153
Tax + insurance
−$221
HOA
−$0
Vac / Maint / Mgmt
−$347
Net cashflow
$-69/mo
Annual
$-833/yr
Cap rate
5.91%
Cash-on-cash
-1.35%
DSCR
0.94
1% rule
0.75%
Cash to close
$61,572
Investor read
- This is a 4-bed/2.0-bath manufactured listed at $220k.
- At list price, monthly cash flow is $-69 ($-833/yr) — negative.
- To cash-flow at today's rent, offer at most $208k (5.6% below list).
- To meet the 1% rule (rent ≥ 1% of price), the offer needs to be $165k (24.9% below list).
- It's been on market 177 days — a 12% lower offer ($194k) is reasonable based on typical stale-listing flexibility.
- Recommended offer: $165k (24.9% below list) — sets the bar for 1% rule.
- In year one you build about $7k of equity ($2k loan paydown + $6k appreciation (2.6% local appreciation)).
- Location reads 60/100 on livability (#255 in CO) — a middle-class / working-renter tenant base. Strengths: employment A+, housing A+, cost of living B; Watch: health & safety C-, crime F, amenities F.
- Pueblo County School District 70 (suburban): math 24% / reading 43% proficiency, ranked #40 of 86 in CO (top 46%) — families likely to look elsewhere, expect single-tenant / working-renter base with shorter leases.
- Zoned schools: Vineland Elementary School (math 15% / reading 42%, grade F, #534 of 966 statewide, top 56%, 308 students, 56% FRL); Vineland Middle School (math 12% / reading 27%, grade F, #207 of 270 statewide, top 79%, 313 students, 63% FRL); Pueblo County High School (math 29% / reading 52%, grade F, #164 of 381 statewide, top 43%, 1,219 students, 46% FRL) — zoned schools average 55% FRL vs 33% district-wide (22 pts higher); higher-poverty schools than district average — tighter screening recommended.
- Market conditions: 25 active listings in the ZIP; 269 units permitted in Pueblo County in 2024 (0 in 5+ unit buildings).
- Pueblo County population projected at +10% by 2050 — modest demand growth; plan on rents tracking national, not racing it.
- 8 sale attempts since 22y ago with the ask held roughly flat each time — persistent listings suggest the price (not the market) is what's stuck; bring a comps-based counter.
- Current owner paid $26k; list at $220k implies a 730% gain — meaningful room to come down on a strong offer.
- At projected returns (2.6% appreciation + 3.0% rent growth), your $62k cash investment doubles in ~8 years — after that, you're playing with house money.
- By year 5, paydown + projected appreciation supports a ~$31k cash-out refi (75% LTV) — recoverable capital for the next deal without selling this one.
Questions for listing agent
- What do current leases actually rent for vs. the listed asking? Can we see a recent rent roll and the last 12 months of T-12 income?
- It's been on market 177 days. Have you received any prior offers? Is the seller open to a 25% concession, seller financing, or rate buy-down credit?
- Why hasn't it sold? Are there any deal-killer items the seller is aware of (foundation, flood, title, zoning, code violations)?
- Is there a deadline driving the sale (1031 exchange, divorce, estate, relocation)? That informs how much negotiation room exists.
- Schools are F-rated, which usually means shorter tenancies and higher turnover. Who's the typical renter profile here, and what's been the actual vacancy rate?
- Crime grade is F in this area — have there been break-ins, vandalism, or insurance claims at this property in the last 3 years? What carrier currently insures it and at what premium?
- The area grade is low — what's the realistic commute time and amenity access for the typical tenant pool here? Any planned neighborhood developments (good or bad) we should know about?
- What's the average days-on-market for RENTAL listings here right now (not sales)? A rising rental-DOM trend means longer vacancies and softer asking-rent achievability than the comps imply.
CashFlowRE · CFR-1WB8526ECTMRKP
· Data 1 week ago
cashflowre.app · 2026-05-29